Report

Written in collaboration with
Written in collaboration with

Executive summary
This is the 12th consecutive year that we have tracked the shopping behaviors of Chinese consumers. Our continuing research has given us a valuable long-term view across 106 fast-moving consumer goods (FMCG) categories purchased for home consumption in China.1 As in each of the past 11 years, we analyzed the 26 key categories that span the four largest consumer goods sectors: packaged food, beverages, personal care, and home care.2 This report updates the findings from our China Shopper Report 2022, Vol. 2, Still Volatile—but with Signs of Hope, and includes Kantar Worldpanel shopper behavior data for 2022 and the first four months of 2023.
This report recaps FMCG performance in 2022, during which consumer behavior remained heavily influenced by the Covid-19 pandemic. We also explore consumer trends from the first four months of 2023, after dynamic Zero-Covid policies were lifted. The report includes implications for consumer goods companies and retailers.
A look back at 2022
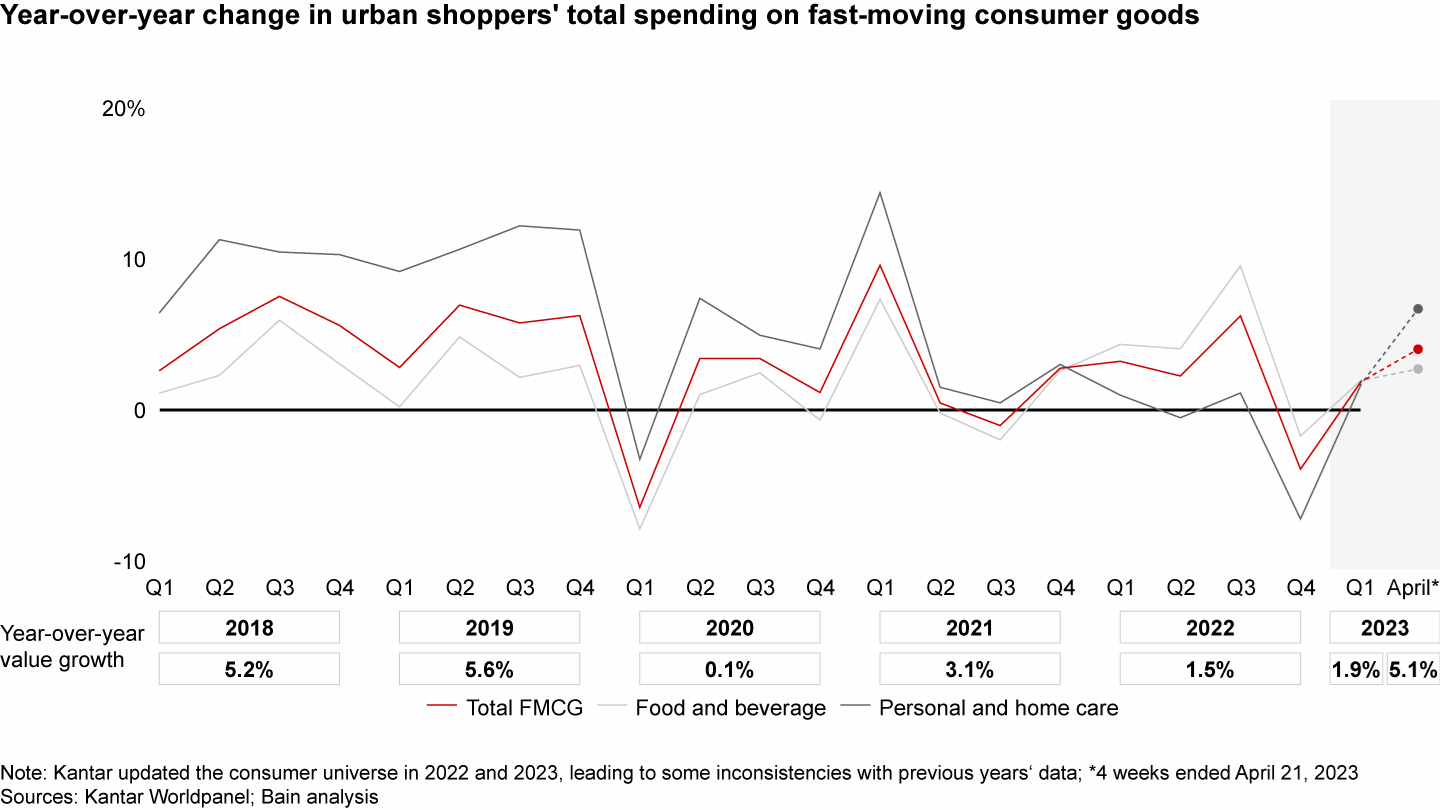
Two major waves of Covid-19-related restrictions—city-wide lockdowns in the first two quarters and a resurgence of mass infections in the fourth quarter—triggered consumption slowdown in 2022. Despite growth of 2.8% in the first half of the year and reaching 6.3% in the fall, an infection spike at the end of 2022 caused value drop of 3.9% in the fourth quarter. As a result, the FMCG market landed at a weak annual growth rate in 2022 (~1.5%), with hyper volatile quarterly performance.
Despite overall volume growth in the first three quarters, FMCG volume dropped 1.2% in the fourth quarter—the first drop since the first quarter of 2020. The FMCG average selling price (ASP) deflationary trend that emerged in 2020 continued throughout 2022 and was even amplified, dropping 2.5% vs. the previous year’s ~1%. The consumer price index (CPI) increased 2% in 2022, and brands continued to experience rising input costs. However, consumers showed a lower willingness to pay for FMCG products given the mounting economic pressures.
Category update: Packaged food and home care dominated growth
Within the four major sectors, packaged food led the growth with a 6.3% increase, its highest in four years. This growth was driven by both volume (3%) and ASP (3.2%). Covid-19 restrictions fueled a shift toward at-home dining, stockpiling behaviors, and an increase in health consciousness. Among the packaged food categories, instant noodle led the sector growth with an ~20% value jump, which peaked in the fourth quarter. Seasoning products like soy sauce and nutrition supplements also saw surges in demand.
Home care experienced healthy growth in 2022 (5.6%), driven both by volume (4.4%) and ASP (1.1%). Heightened attention to hygiene fueled demand for categories such as facial tissue (11.8%) and toilet tissue (7.1%). ASP growth was driven by price increases of raw materials and manufacturer-led premiumization.
Beverage was especially vulnerable to Covid-19 disruption, resulting in weak annual growth of 1.1%. After a strong 10.4% recovery in the third quarter, beverage experienced a value drop of 6.8% in the fourth quarter. The annual value growth was largely driven by volume increases (5.1%), while ASP continued to decline throughout the year (-3.8%). Juice, ready-to-drink tea, and functional drinks led the sector’s growth—a healthy payoff for manufacturers’ innovations in health-related concepts. Wine/foreign spirit, and Chinese spirit categories reported significant ASP decline due to lower consumption and consumers’ reduced willingness to pay during the pandemic.
Personal care continued its declining trend throughout the year. After a significant drop of 10.9% in the fourth quarter, it ended the year with a total value decline of 4.8%. The steep decline was caused by a severe reduction in outdoor occasions and social activities, especially during virus outbreaks. The ASP decline (-4.9%) drove the sector’s drop in value in 2022, even though volume growth was flat. Makeup continued its decline (-18.1%) in both volume (-14.2%) and ASP (-4.6%). Makeup demand dropped significantly when social occasions were halted and mask-wearing mandates were in effect. Meanwhile, skin care and toothbrush values declined 3.8% and 7.8%, respectively. Those were mainly driven by ASP decline, caused by fierce competition and consumers’ lower willingness to pay. Personal hygiene-related categories like personal wash and toothpaste performed relatively well in 2022, achieving value growth of 2.5% and 1.2%, respectively.
The two-speed growth phenomenon we first identified in 2016 is still happening. High-speed categories were largely concentrated in food, beverage, and personal hygiene, while many nonessential and replaceable categories experienced negative growth.
In 2022, we observed that some categories that were highly sensitive to Covid-19, like instant noodle (20%) and hand wash (11%), changed from low-speed categories in 2021 to high speed in 2022, due to increased demand during Covid-19 outbreaks. In contrast, fragrance reversed its performance (-11%) in 2022. Meanwhile, some categories saw consistent high-speed growth over the past few years, such as ice cream (CAGR 2019–22 at ~20%) and carbonated soft drinks (CAGR 2019–22 at ~15%). Their growth was driven by an “indulgence mentality” among consumers, as well as fast innovations introduced by domestic players. Another example is facial tissue (CAGR 2019–22 at ~10%), which benefited from heightened consciousness around health and hygiene. On the other hand, yogurt has been a low-speed category for three years, with CAGR 2019–22 down 10%, as it lost its competitive value proposition against substitute products such as milk and juice.
Channel update: E-commerce growth slowed, while O2O soared
In 2022, overall e-commerce growth slowed in 2022, ending the year with only 2% growth. The channel was challenged by logistics disruptions during lockdowns and nationwide infections, as well as heightened regulatory scrutiny of key opinion leaders and the livestreaming industry. Smaller formats picked up momentum. Convenience stores grew 7%, and grocery grew 8%, thanks to the predictability, convenience, and safety of shopping at nearby locations during the pandemic. Online-to-offline (O2O) boomed during Covid-19 resurgence periods,3 as consumers wanted to stock up and fulfill instant needs while avoiding traffic and exposure in physical stores. As a result, FMCG O2O saw 18% value growth in 2022 overall, and channel share increased from 5.7% to 6.7% of total FMCG.
Brand update: Large brands and domestic brands pulled ahead
In 2022, brand competition remained dynamic. Among the 26 categories we tracked, the top five brands regained share in a few categories that long-tail/insurgent brands had won over in the previous two years. The change is similar to what we observed in the first quarter of 2020. During turbulent times, larger brands tend to be more trusted by consumers and have more resilient supply chains, distribution networks, and financial resources. The categories where the top five brands regained share included facial tissue, instant noodle, and ready-to-drink tea, etc.
Similar to previous years, on aggregate, local brands further gained share from foreign brands in these 26 categories, mainly through volume gains, while ASP decreased for both local and foreign brands. Interestingly, in 2022, foreign brands had significant ASP decreases in a few categories with clear trade-down trends, such as skin care and toothbrush.
The first quarter of 2023 provides insight into future trends
The first quarter of 2023 revealed promising signs of a mild economic rebound—and an indication of what brands should expect from consumers for the rest of the year. China’s GDP growth in the first quarter (4.5%) and overall retail sales growth (10.5% in March, excluding auto) both exceeded expectations. Domestic traffic and catering sales also bounced back quickly in the first quarter of 2023. However, full recovery takes time, and certain concerns persist. The Consumer Confidence Index showed a steady upward trend, but has yet to return to pre-pandemic levels. Additionally, the unemployment rate remained around 5.5%, with youth unemployment (16–24-year-olds) at a high level.
Overall, the FMCG industry rebounded from the fourth quarter of 2022 and reported value growth of 1.9% in the first quarter of 2023, driven by modest volume growth (2.7%), despite a decline in ASP (-0.8%). Although the FMCG growth rate in the first quarter was moderate, it was very different on a month-by-month basis. For example, January was severely affected by a Covid-19 outbreak. The trajectory, however, drives optimism for consumption in the coming months. In April, the FMCG market achieved an exciting growth at 5.1%, in line with pre-Covid-19 levels. Overall retail sales, excluding auto, also saw impressive growth in April at 16.5%.
Category update: Packaged food and home care continued to grow, while personal care and beverage showed signs of recovery
Across all four major sectors, home care continued to lead growth at 13% in the first quarter and achieved the highest quarterly growth since the third quarter of 2020, thanks to sustained health awareness. The substantial growth was driven by both volume (9.5%) and ASP (3.2%). Nearly all key categories grew due to sustained and heightened attention to hygiene and health needs. Packaged food continued to grow at 3.2%. Growth was mainly driven by an ASP increase (5.2%), but volume dropped 2%. Categories such as biscuits, chocolate, and candy experienced value drops in the first quarter due to less stockpiling behaviors. Seasoning and nutrition supplements maintained their growth trajectories due to ongoing pandemic-era cooking habits and health needs. Moreover, April data showed that home care and packaged food sustained growth of 12.2% and 3.8%, respectively.
Beverage and personal care showed signs of recovery as social gatherings increased. Beverage value grew 1% in the first quarter of 2023, driven by volume growth of 3.4%, while ASP declined 2.4%. Juice, ready-to-drink tea, milk, and packaged water continued to lead the sector’s growth. In April, the sector experienced further growth of 3.3%, displaying its rebound trajectory.
In personal care, the trend of declining value slowed in the first quarter of 2023 (-2.6%), with an increase in volume (4.1%) thanks to increased social occasions. Most categories, such as hair conditioner and personal wash, showed clear volume growth compared with the first quarter of 2022. In April, the sector achieved an exciting growth of 5.9%, providing confidence for the upcoming months.
Categories reflected predictable rebound patterns
We revisited four distinct category rebound trajectories that were identified in 2020, to better anticipate trends in the coming months:
• Continuous booming categories benefited during Covid-19 outbreaks in December 2022 and January 2023 and achieved stable growth afterward.
• Boom and stabilize categories grew during outbreaks but did not sustain their growth post-Covid-19.
• V-shape and stabilize categories were hit hard by the pandemic but rebounded afterward.
• L-shape categories declined during and after the outbreak and took longer to recover.
In this study, the four distinct patterns continued into the first quarter of 2023, though the level of divergence was less pronounced and convergence came more quickly. This was because consumers’ stockpiling behaviors decreased as Covid-19-related restrictions relaxed. In addition, a significant increase in outdoor activities drove a sharper rebound of certain relevant categories like shampoo and fabric detergent.
Zooming into the continuously tracked categories, the majority rebounded similarly to 2020, but some responded differently, affected by four factors.
First, Zero-Covid policies were lifted quickly in 2023, which increased social occasions and enabled makeup and wine/foreign spirits to shift from an L-shape pattern to a V-shape. Second, a decline in birth rates since 2020 shifted baby-related categories (e.g., infant formula and diaper) from V-shape and boom and stabilize patterns in 2020 to L-shape in 2023. Third, category education and consumer lifestyle changes drove sustainable growth in categories such as juice, ready-to-drink tea, and pet food. Finally, the long epidemic outbreak in the first quarter drove hygiene and health-related categories such as toilet and facial tissue toward the continuous booming pattern.
Pricing update: Pricing trends across categories further diverged
In the first quarter of 2023, the FMCG market continued its deflationary trend that started in the beginning of 2020. However, the deflation was not uniform across all categories, channels, or brands.
Facing continuously rising input costs, FMCG brands continued to push for price increases to manage their margins. However, overall ASP continued to decline. Aligned with our findings in 2022 Vol. 2, generally the overall ASP decline in the first quarter of 2023 continued to be driven by trade downs (i.e., consumers choosing a lower-priced product) and shifts to online (i.e., consumers choosing a lower-priced channel). Promotion rates abated a bit compared with previous years for both online and offline channels.
Brands across all sectors increased like-for-like pricing in the first quarter of 2023, but consumers reacted differently to the price increases across sectors. In the packaged food sector, consumers significantly decreased purchase volume as stock-up needs eased after Covid-19, but chose more expensive products thanks to rising health awareness. In the beverage sector, consumers opted for more value-for-money products. Consumers continued to increase purchase volume in home care due to their cultivated health and hygiene needs, while opting for cheaper products. Although demand for personal care products increased post-Covid-19, consumers switched to discounted online channels to cope with rising product prices and opted for more value-for-money alternatives (i.e., trading down), or simplified their daily routine.
Looking at the 26 tracked categories, pricing trends became more divergent. Some categories continuously premiumized with an ASP increase, while others sustained an ASP decline.
Continuous premiumization: Categories in this pattern succeeded with strong innovations, typically by addressing consumers’ rising health and hygiene needs. For instance, juice continued to premiumize in the first quarter. The premium juice segment achieved 25% volume growth, and ASP increased 7%, thanks to successful premium innovations such as new processing methods (e.g., NFC) and new flavors (e.g., Chinese medicine-based products). Instant noodle also innovated with healthy products that were enabled by new technologies (e.g., freeze-drying). The premium segment of instant noodle experienced 27% volume growth, while the midrange and mass segment saw volume declines of 9% and 27%, respectively.
Continuous ASP decline: Categories in this pattern often face trade-down behaviors or lower demand. The toothbrush category is representative of this. In recent years, an increasing number of local insurgent brands entered the market and offered more affordable electronic products. The intensified competition pushed premium brands to launch more economic product lines. As a result, across all price tiers, the mass segment of toothbrushes had the highest volume growth at 4%, with a 9% ASP decrease in the first quarter. The other example is infant formula, which experienced a sharp decline in value due to lower birth rates in the last few years. To remain competitive, brands adopted lower pricing strategies through increased promotional activities. In the first quarter of 2023, nearly 50% of the market value was sold on promotion.
Channel update: E-commerce reaccelerated, club warehouses soared, and O2O sustained growth
The lift of Covid-19 policies further shaped the channel dynamics in the FMCG industry. In the first quarter, some historical trends continued, for example the rise of smaller formats (e.g., convenience stores and grocery), the club warehouse format, and O2O. On the other hand, we observed changes compared with previous years. For example, e-commerce went from idle growth in 2022 to accelerated growth in the first quarter of 2023, and an amplified decline of hypermarket.
In the first quarter of 2023, consumers accelerated their shift toward online channels, reaching a growth rate of 9%—up from 2% in 2022, thanks to Covid-19 infections subsiding and the resumption of logistics. All 26 categories showed positive online penetration growth in the first quarter of 2023 vs. the first quarter of 2022, whereas more than half of the categories experienced online penetration declines in 2022. Among the e-commerce platforms, interest e-commerce platforms like Douyin(抖音)and Kuaishou(快手) led the growth. Douyin gained significant traction in sales value and overtook Pinduoduo, becoming the third-largest e-commerce platform by sales value in FMCG in the first quarter of 2023.
Hypermarkets experienced an accelerated downward trend in the first quarter, with a 12% decrease in sales value. The dip was a combined result of a reduction in the number of stores, lower traffic due to the pandemic, and operational challenges faced by some key retailers. However, the club warehouse format (a hypermarket subtype in Kantar Worldpanel’s classification) enjoyed strong growth (38%) due to a growing number of shoppers and increased shopping frequency.
O2O shopping habits have been growing over the past few years and continued to thrive, even after Covid-19-related policies were relaxed. FMCG O2O witnessed remarkable value growth in the first quarter (16%). The growth was mainly driven by increased purchase intensity (e.g., higher shopping frequency or higher value per trip) and gains from non-O2O channels, particularly offline hypermarkets, supermarkets, and mini markets.
Across different sectors, O2O is more important in the food category (packaged food and beverage) than nonfood (personal care and home care). However, nonfood showed more exciting growth (~30%). Nonfood growth was driven by a few fast-growing categories (e.g., facial and toilet tissue) and an increase in cross-purchasing behaviors. Compared with traditional online platforms, O2O has advantages in necessity categories with instant needs such as frozen food, facial tissue, and toilet tissue, thanks to fast delivery. Meanwhile, unlike traditional e-commerce, where food and beverage significantly lag in penetration, categories such as soy sauce and milk have surpassed some personal care and home care categories in O2O penetration.
Among the four types of O2O platforms we’ve tracked closely since 2020, offline retailers and community group buys drove growth through aggressive expansion led by the leading players. The horizontal marketplace and vertical grocery EC showed more stable growth and even declined.
Out-of-home consumption rebounded
The release of pandemic-related restrictions ushered in a resurgence of outdoor activities. As a result, domestic traffic and catering sales swiftly rebounded from the start of 2023.
For the 11 tracked key food and beverage categories in Tier 1 and 2 cities,4 out-of-home (OOH) consumption steadily recovered, obtaining 4.6% growth in April. Restaurant enjoyed the highest growth (36%) among all channels, thanks to an increase in OOH catering occasions. As a result, on-premises drinks such as beer, juice, and ready-to-drink tea saw outstanding growth rates of 11.0%, 20.7%, and 19.0%, respectively.
What’s next—and implications for brands and retailers
China’s recovery from its year-end Covid-19 outbreak and subsequent release of Zero-Covid policies has produced the expected bounce back in economic activities, as evidenced by first quarter GDP growth and retail sales. Economists expect the recovery to accelerate in the second half, particularly on the back of a low base of comparison in the same period in 2022. Consumption will remain the key factor of economic growth, with consumer confidence showing a steady uptick trend. Furthermore, the government has already implemented stimulus policies to boost consumption and is expected to announce more.
Following the economic recovery, the FMCG industry continues to demonstrate resilience, as consumers, brands, and retailers are adapting to ever-changing circumstances. The FMCG recovery trend is likely to continue over the coming months, repeating a few trends from the first quarter of the year.
Implications for brands
In an evolving market with volatile shifts in consumer needs and preferences, it’s vital that brands closely monitor shifts in consumer needs, as well as competitors’ moves, so they can optimize portfolio and pricing strategies to maximize brand value. Increasing price sensitivity by consumers should lead FMCG brands to adjust their cost position and reinvest savings in marketing and price/promotion. Changing and proliferating channel dynamics require brands to integrate channel strategies and break silos between online and offline channels in planning. Moreover, given the resurgence of OOH consumption, brands should strategically reinvest in food service-related opportunities.
Implications for retailers
With fierce competition, retailers should focus on clearly defined core shopper segments. They can enhance shopper loyalty through differentiated value propositions that are embedded in merchandising, pricing and promotions, and shopper engagements. Category trends related to demand and pricing are still evolving, so retailers are encouraged to refine category roles and assess product economics down to SKU-level granularity. Lastly, the O2O trend is growing and irreversible. Retailers need to fully capture the opportunity by amplifying their self-built O2O services or seeking partnerships with the leading O2O partners.
The full report
In our report, we recap fast-moving consumer goods (FMCG) performance in 2022, during which consumer behavior remained heavily influenced by the Covid-19 pandemic. We also explore consumer trends from the first four months of 2023, after dynamic Zero-Covid policies were lifted. The report includes implications for consumer goods companies and retailers.
This is the 12th consecutive year that we have tracked the shopping behaviors of Chinese consumers. Our continuing research has given us a valuable long-term view across 106 FMCG categories purchased for home consumption in China. As in each of the past 11 years, we analyzed the 26 key categories that span the four largest consumer goods sectors:2 packaged food, beverages, personal care, and home care. This report updates the findings from our China Shopper Report 2022, Vol. 2, Still Volatile—but with Signs of Hope, and includes Kantar Worldpanel shopper behavior data for 2022 and the first four months of 2023.
A look back at 2022
In 2022, China continued to be severely affected by Covid-19. Two major waves of Covid-19-related disruption—city-wide lockdowns in the first two quarters and resurgence of mass infections in the fourth quarter—triggered consumption slowdown, eroded consumers’ income and buying power, and also disrupted supply chains and logistics. As a result, the FMCG market landed at a weak annual growth rate in 2022 (~1.5%), with hyper volatile quarterly performance. Despite resilient growth in the first two quarters (2.8%) and strong recovery in the third quarter (6.3%), infections in December disrupted the FMCG market, resulting in a 3.9% value decline in the fourth quarter (see Figure 1).
Figure 1
After a resilient H1 and robust Q3, FMCG market experienced -3.9% growth in Q4 due to the Covid-19 outbreak, weakening annual growth to 1.5%

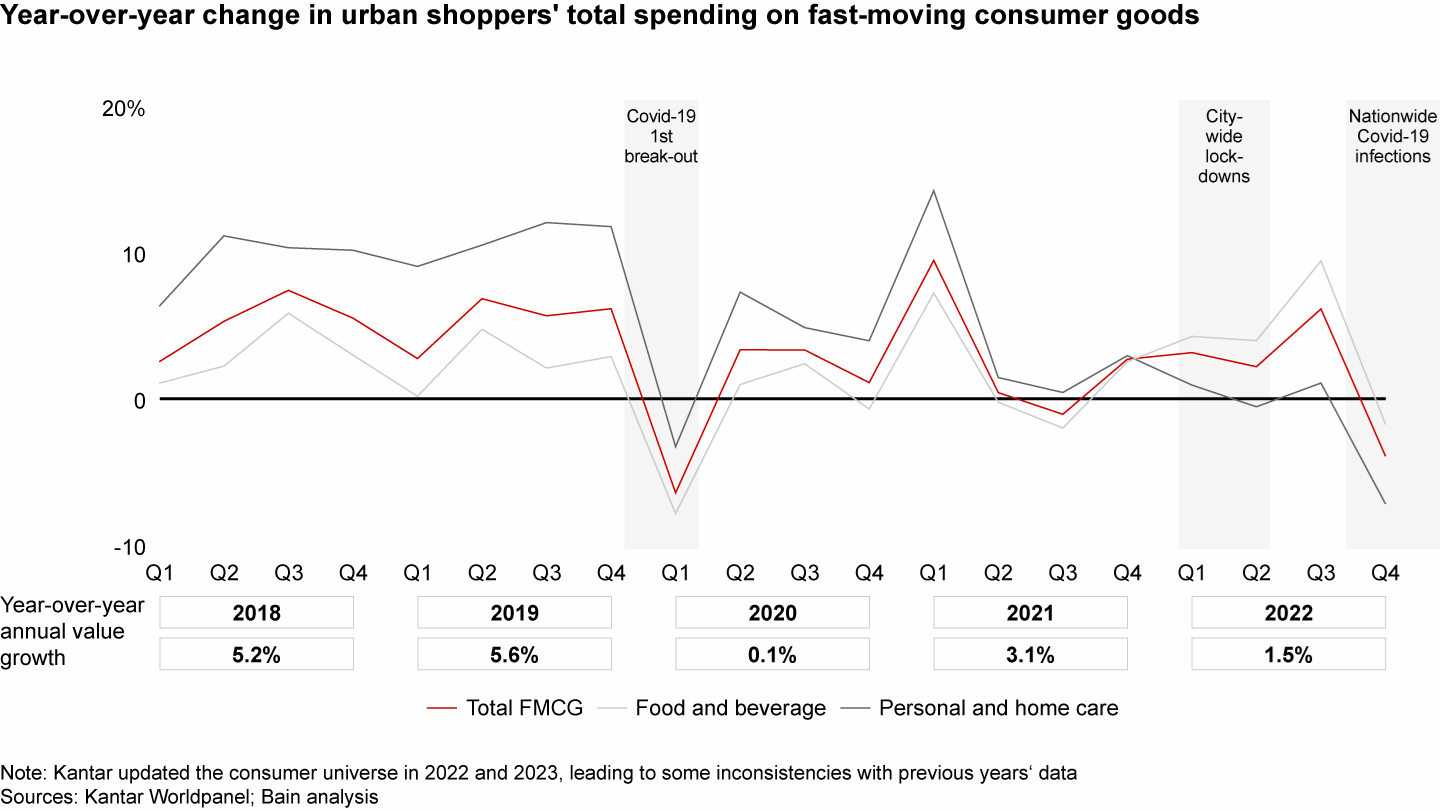
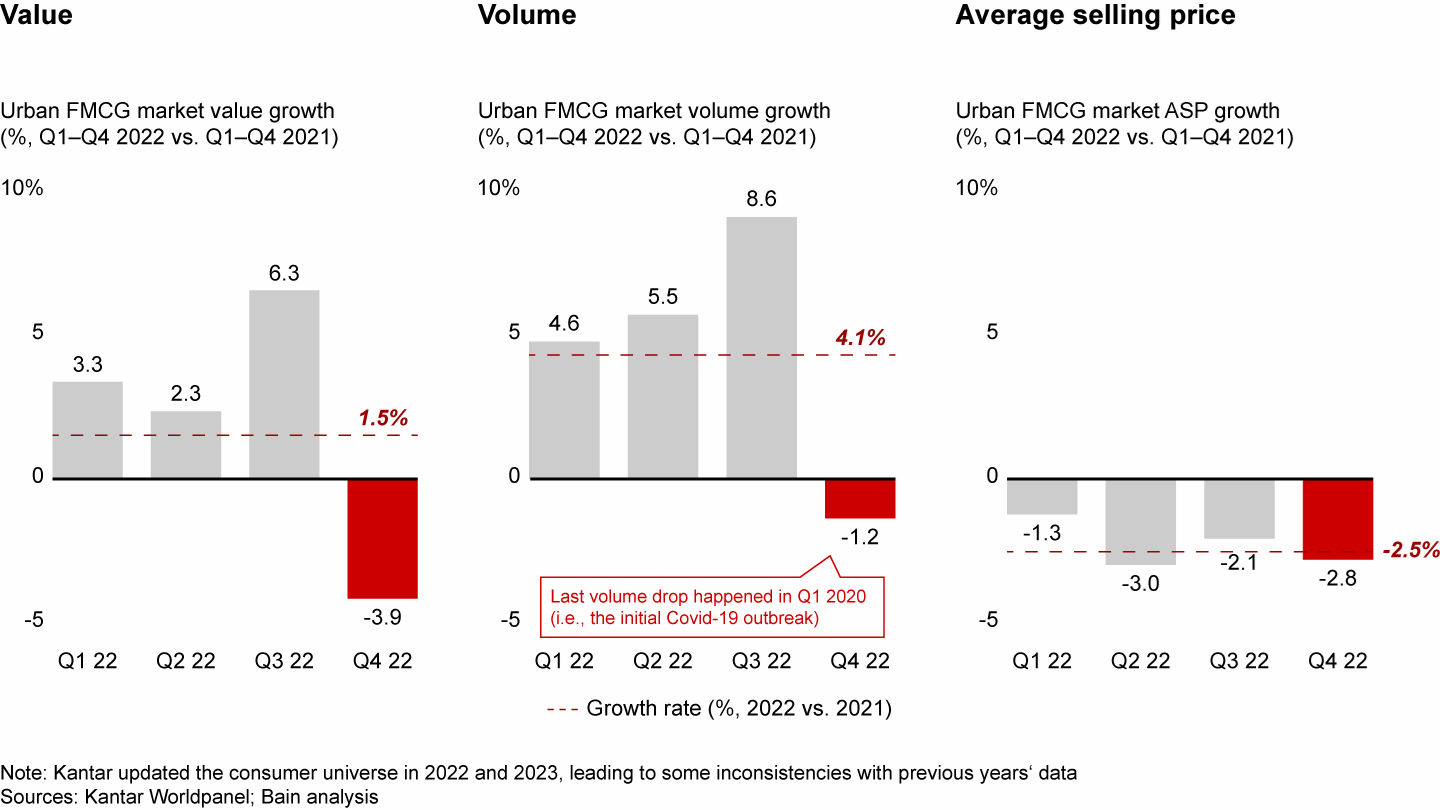
Despite overall volume growth in the first three quarters, FMCG volume dropped 1.2% in the fourth quarter—the first drop since the initial outbreak period in the first quarter of 2020. This drop can be explained by a reduction in stockpiling activities as Covid-19-related restrictions relaxed, and consumers using stocked products they had purchased in previous quarters. Infections also eroded purchase intent.
The average selling price (ASP) deflationary trend, which was first observed in 2020, continued throughout the year. In fact, it dropped precipitously. It fell 2.5% in 2022 vs. ~1% the prior year (see Figure 2). The consumer price index (CPI) increased by 2% in 2022, and brands continued to experience rising input costs. However, consumers showed a lower willingness to pay for FMCG products given the mounting economic pressures.
Figure 2
Price deflation occurred throughout the year; in Q4, volume dropped for the first time since Q1 2020, leading to value decrease

Packaged food and home care dominated growth
Among the four sectors, packaged food experienced robust growth in 2022, with an increase of 6.3%—the highest increase in the past four years (see Figure 3). Growth was driven by both volume (3%) and ASP (3.2%). As the Covid-19 pandemic unfolded in 2022, lockdowns and restrictions on dining out compelled people to explore at-home dining solutions and fueled stockpiling behaviors.
Figure 3
Packaged food and home care led growth, beverage growth slowed down, and personal care reversed its growth trends due to suppressed needs in 2022

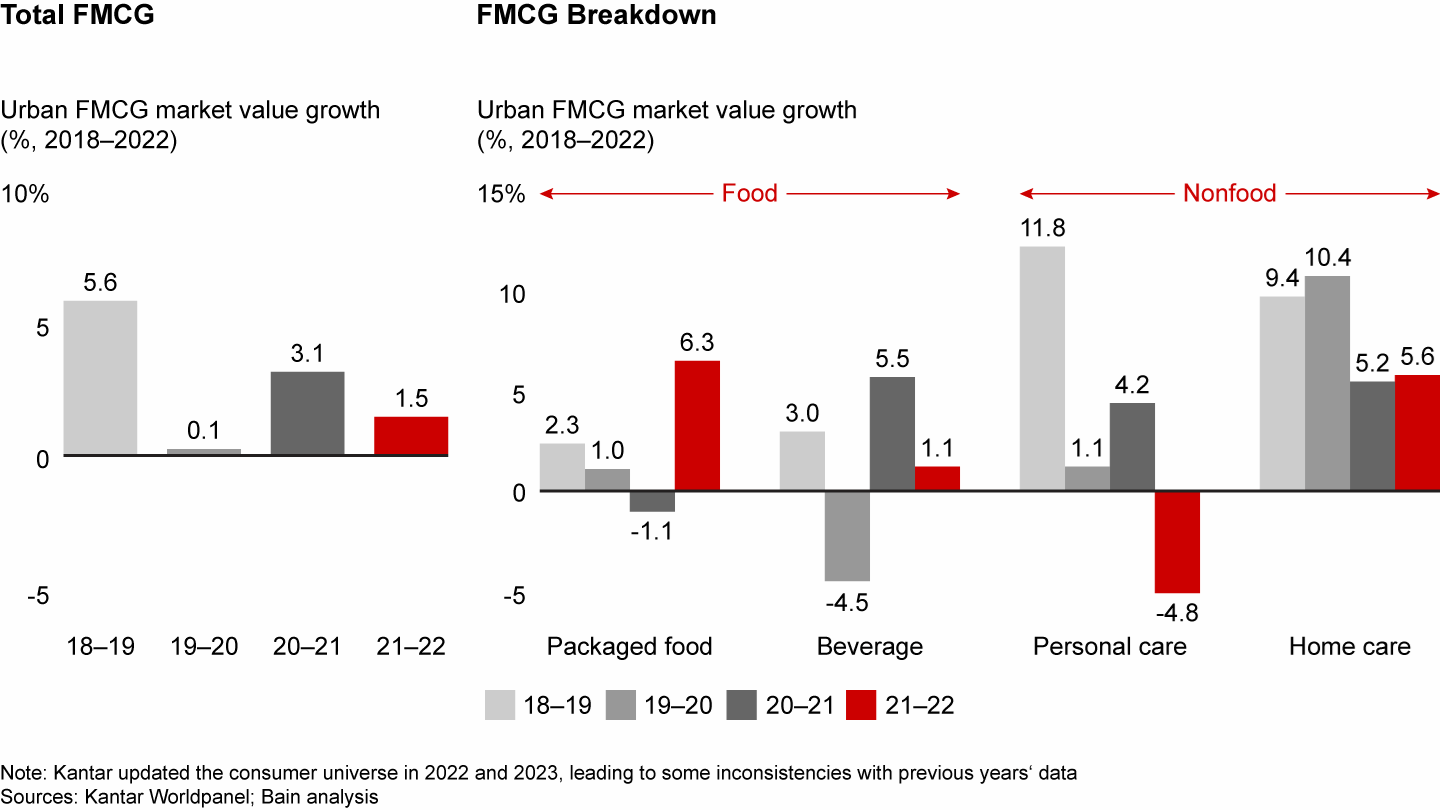
Within the sector, instant noodle emerged as a leading force, enjoying an extraordinary fourth quarter and ~20% value growth for the year. Similarly, seasoning products like soy sauce also saw surges in demand from in-home cooking. Likewise, nutrition supplements picked up growth due to an increase in health consciousness.
The sector’s healthy ASP increase (3.2%) was partially driven by premium product innovations. With more attention on health, consumers showed a willingness to pay for healthy concepts in the packaged food sector.
Besides packaged food, home care also enjoyed healthy growth in 2022 (5.6%), driven by both volume (4.4%) and ASP (1.1%). Unsurprisingly, heightened hygiene awareness from the Covid-19 outbreaks fueled demand for some hygiene-related categories, such as facial and toilet tissue. In 2022, facial and toilet tissue achieved value growth of 11.8% and 7.1%, respectively. The sector’s ASP growth (1.1%) was driven by both price increases of raw materials and manufacturer-led product premiumization.
Beverage faced significant challenges during Covid-19 lockdowns and nationwide infections, resulting in a weak full-year value growth of only 1.1%. It enjoyed a strong recovery of 10.4% during the post-lockdown periods in the third quarter. Unfortunately, the sector experienced a value decline in the fourth quarter (-6.8%) due to significantly reduced consumption, especially in alcohol-related categories, because of the infections and persistent health concerns. The overall sector value growth was largely driven by volume increase (5.1%) while ASP declined (-3.8%). Within the sector, juice, ready-to-drink tea, and functional drinks led the growth thanks to health-focused concepts and innovations pushed by manufacturers. In terms of ASP, juice showed a significant increase as a result of premium innovations like not-from-concentrate (NFC) juice and zero-sugar options. However, wine/foreign spirit, and Chinese spirit categories showed substantial ASP decline in 2022 from reduced consumption and willingness to pay.
Consumers’ avoidance of social gatherings in 2022 hurt personal care throughout the year. It experienced a significant value drop of 10.9% in the fourth quarter, landing on a full-year value decline of 4.8%. ASP decline drove the sector value drop in 2022, though volume growth was flat. Within the sector, makeup continued to experience significant volume decline (-14.2%) and ASP deflation (-4.6%) due to fewer social occasions and ongoing mask-wearing policies. Meanwhile, both the skin care and toothbrush categories showed clear ASP decline, -4.8% and -6.8%, respectively, as consumers shifted toward more value-for-money options enabled by fierce competition. Personal hygiene-related categories like personal wash and toothpaste had relatively stable performances in 2022, achieving value growth of 2.5% and 1.2%, respectively.
The two-speed growth phenomenon we first identified in 2016 was still evident. Consistent with our findings in 2022 Vol. 2, high-speed categories were largely concentrated in food, beverage, and personal hygiene, while many nonessential or replaceable categories experienced negative growth (see Figure 4).
Figure 4
Two-speed growth continued in 2022, with categories highly reactive to Covid-19 and categories showing a consistent growing trend in the past three years

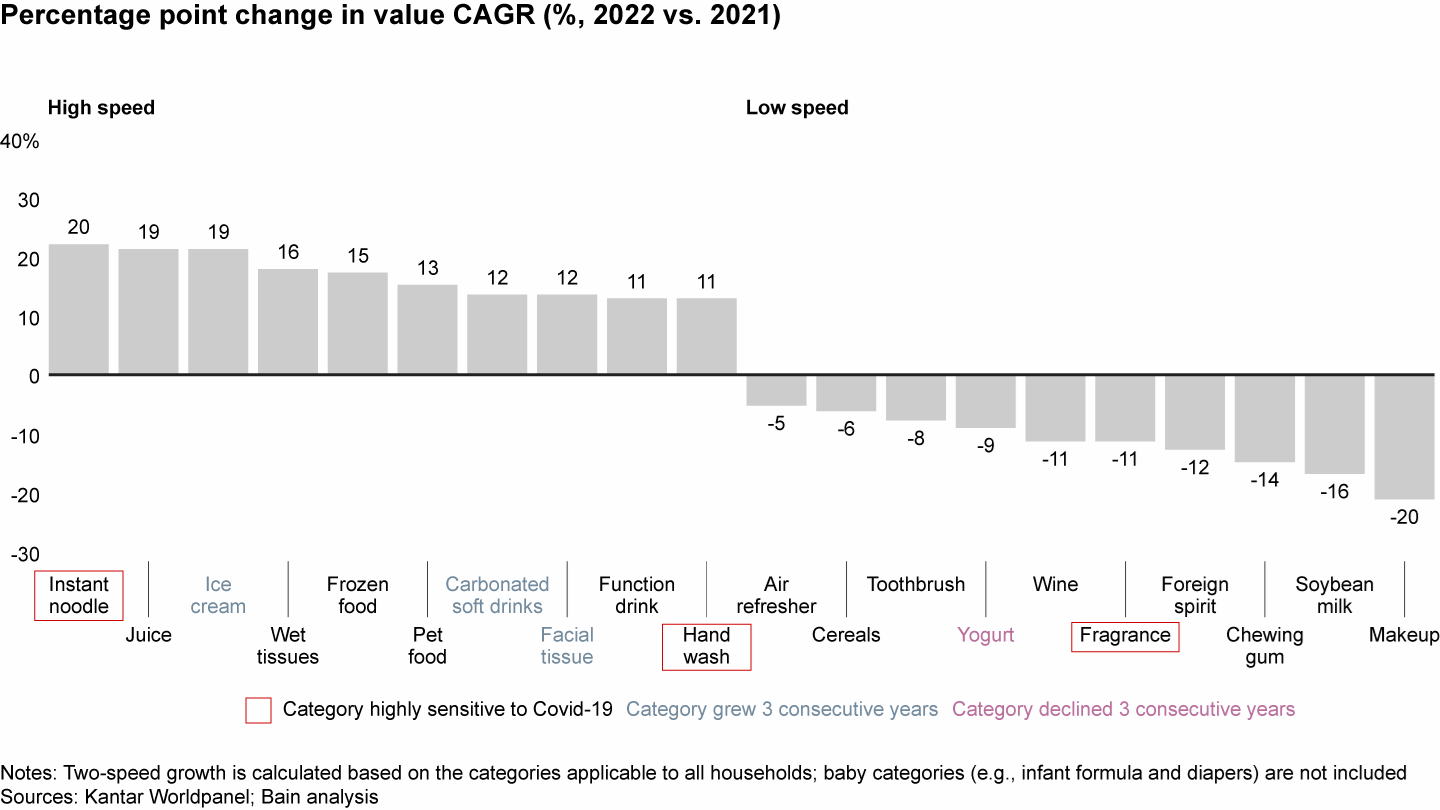
In 2022, we observed that some categories were highly sensitive to Covid-19, such as instant noodle, hand wash, and fragrance. Instant noodle showed exciting growth at 20% in 2022 thanks to the increase in at-home eating. In contrast, it experienced negative growth (-10%) in 2021, when the pandemic subsided. Similarly, demand for hand wash surged to 11% growth in 2022, when hygiene concerns were top of mind, but declined 10% in 2021. Fragrance was the opposite. It enjoyed 28% value growth in 2021, but declined 11% in 2022, when social occasions were drastically reduced.
Meanwhile, a few categories have shown consistent growth over the past three years. A “little treats mentality” during lockdowns continued into 2022 and benefited categories such as ice cream (CAGR 2019–22 at ~20%) and carbonated soft drinks (CAGR 2019–22 at ~15%). Similarly, facial tissue (CAGR 2019–22 at ~10%) maintained demand due to ongoing health considerations. On the other hand, yogurt maintained a declining trend (CAGR 2019–22 down 10%) due to its weakening value proposition vs. substitutions such as milk and juice.
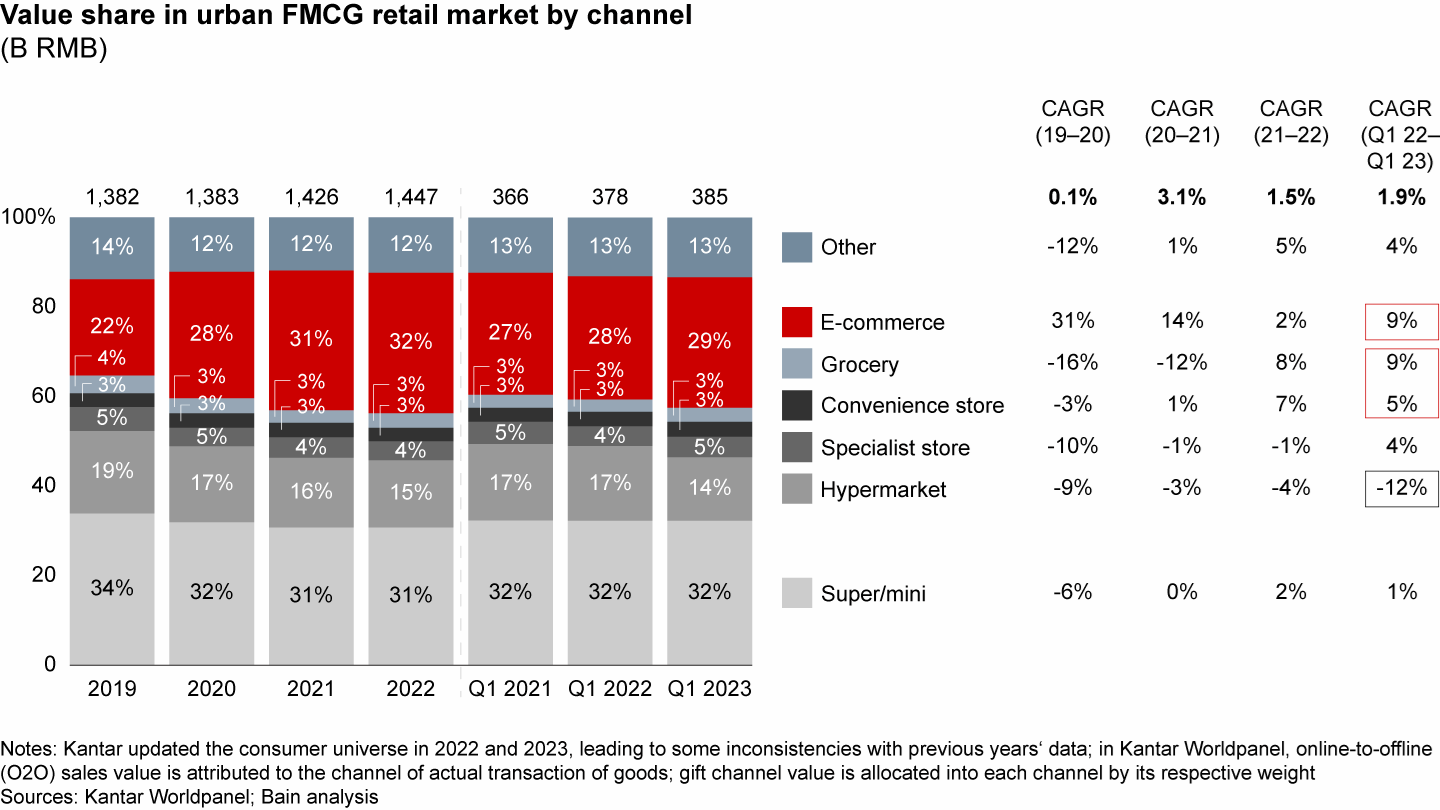
E-commerce growth slowed while O2O soared
Consistent with our findings in 2022 Vol. 2, growth in e-commerce slowed in 2022. The year-over-year growth rate was 2% in 2022, relative to ~14% in 2021. E-commerce stagnation was a result of logistic disruptions that occurred during lockdowns in the first and second quarters and nationwide infections in December, as well as heightened regulatory scrutiny of key opinion leaders and the livestreaming industry. In contrast, convenience stores and grocery gained traction, achieving 7% and 8% year-over year growth, respectively. They benefited as consumers preferred the predictability, convenience, and safety of shopping at nearby locations during the pandemic (see Figure 5).
Figure 5
E-commerce kept gaining share while growth continued to slow down; small offline formats (convenience store, grocery) outgrew

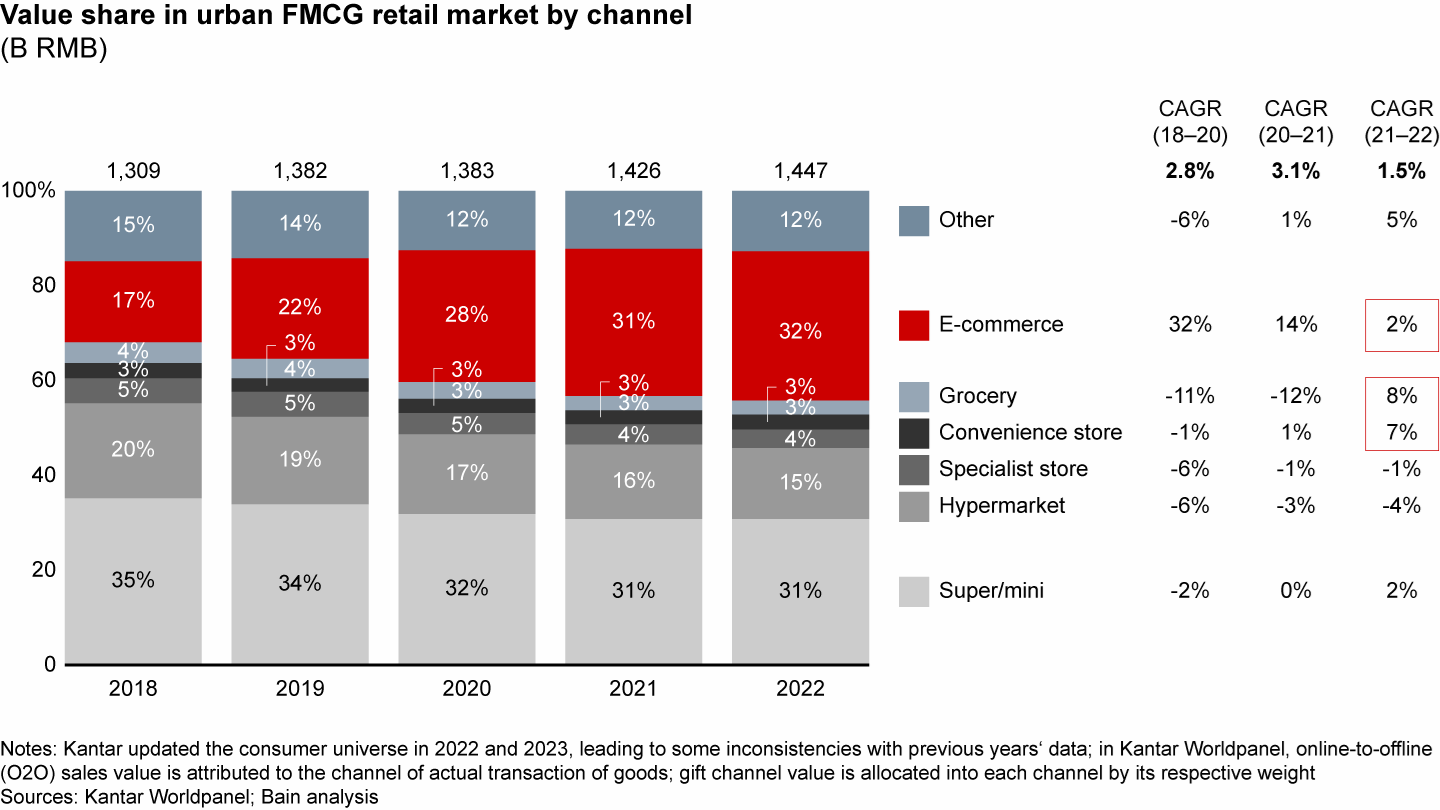
Online-to-offline (O2O) boomed during Covid-19 outbreaks as consumers stocked up and fulfilled instant needs while avoiding traffic and exposure in large physical stores. As a result, FMCG O2O saw 18% value growth in 2022 and channel share increased from 5.7% to 6.7% of total FMCG. O2O became a critical value contributor for the top 10 offline key accounts, accounting for ~15% share, on average, with contribution ranging from 5% to 50% individually.5
Large brands and domestic brands pulled ahead
Brand competition remained dynamic. We compared category share gains and losses between large brands and their smaller insurgent counterparts, as well as between foreign and domestic brands.
In the battle between large and small brands, we found that, in 2022, the top five brands regained share in a few categories in which long-tail/insurgent brands had won in the previous two years. This change is similar to what we observed in the first quarter of 2020. During turbulent times, larger brands tend to be more trusted by consumers and have more resilient supply chains and distribution networks, as well as financial strength. For example, in the facial tissue category, an increase in raw materials caused a few small tissue brands to experience profitability issues and exit the market, benefiting larger brands. At the same time, long-tail brands managed to continue gaining share in some categories, such as juice, in which insurgent brands like Lingduguofang(零 度果坊), DrinkClean(纯饮), and Genki Forest(元气森林)innovated in health-focused concepts to spur growth. Similarly, in the toothbrush category, many small local brands entered the electronic toothbrush segment and aggressively gained share with value-for-money positioning (see Figure 6).
Figure 6
Brand competition remained dynamic; top 5 brands regained share in a few categories in which long-tail (insurgent) brands were winning in previous 2 years

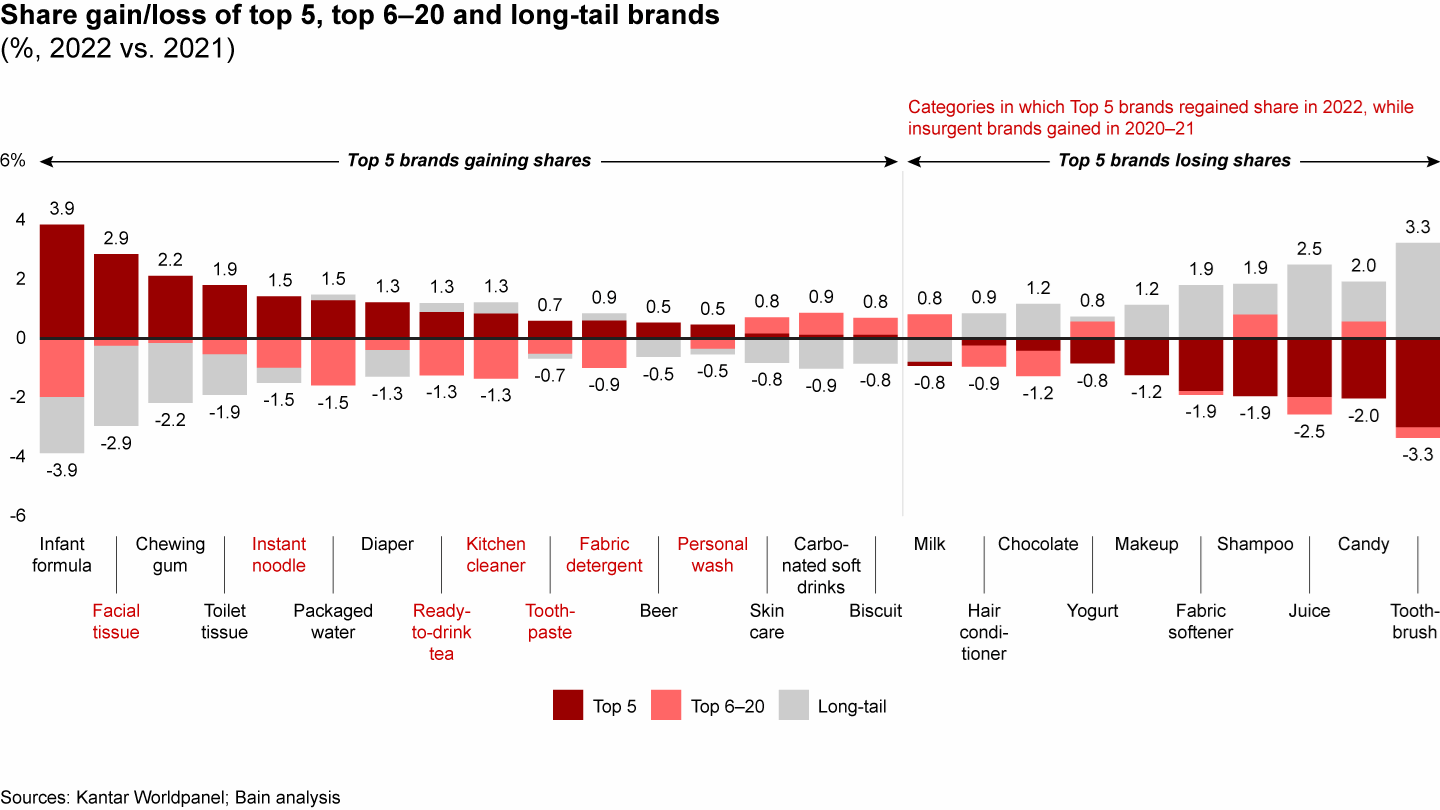
Competition between foreign and domestic brands showed similar trends to previous years. Among the 26 categories that we track, domestic brands gained share from foreign brands on aggregate, mainly through volume gains, while ASP decreased. Domestic brands performed strongly in a few categories, such as instant noodle and juice. In 2022, foreign brands lost value through both volume and ASP. Interestingly, significant ASP decreases were observed in a few categories, with clear trade-down trends, such as skin care and toothbrush.
The first quarter of 2023 provides insight into the road ahead
After a challenging year in 2022, China’s economy has been gradually rebounding. The first quarter of 2023 showed promising signs of economic recovery and suggested a positive trajectory for the rest of the year. Notably, China’s economic growth and overall retail sales both exceeded expectations. GDP expanded 4.5% in the first quarter. Total retail sales, excluding auto, achieved 10.5% growth in March and 16.5% growth in April. Moreover, domestic traffic also resumed, evidenced by a ~20% total increase in subway traffic across 29 major cities, resembling March 2019 levels. Likewise, catering sales enjoyed 26.3% growth in March and 43.8% in April. However, full recovery takes time, and some concerns persist. By March, the Consumer Confidence Index showed a steady upward trend but has yet to return to pre-pandemic levels. This suggests consumers are gradually gaining confidence now that the government’s Zero-Covid policies have ended, but many are hesitant to resume their pre-Covid-19 spending patterns. Additionally, the unemployment rate remained around 5.5%, with youth unemployment (16–24-year-olds) surging to 19.6% in March and affecting the immediate purchasing power of young consumers.
Overall, in the first quarter, the FMCG industry rebounded from the fourth quarter of 2022 and reported value growth of 1.9%, driven by modest volume growth (2.7%), despite a decline in ASP (-0.8%). Both food and nonfood sectors rebounded to positive growth, hitting 2.0% and 1.7%, respectively (see Figure 7). While the overall FMCG growth rate was moderate in the first quarter, the month-by-month basis was more volatile. January was severely affected by a Covid-19 outbreak. The trajectory, however, drives optimism for consumption in the coming months. April experienced an exciting FMCG growth of 5.1%.
Figure 7
China FMCG recovered slowly in Q1 2023 to about 1.9% growth, and achieved a growth at 5.1% in April

Packaged food and home care continued to grow, while personal care and beverage showed signs of recovery
Across all four major sectors, home care continued to lead growth at 13% in the first quarter, achieving the highest quarterly growth rate since the third quarter of 2020. Packaged food also grew 3.2%. Beverage and personal care showed signs of recovery as social gatherings increased (see Figure 8).
Figure 8
Home care achieved significant growth in the first four months in 2023, while beverage and personal care showed clear signs of recovery

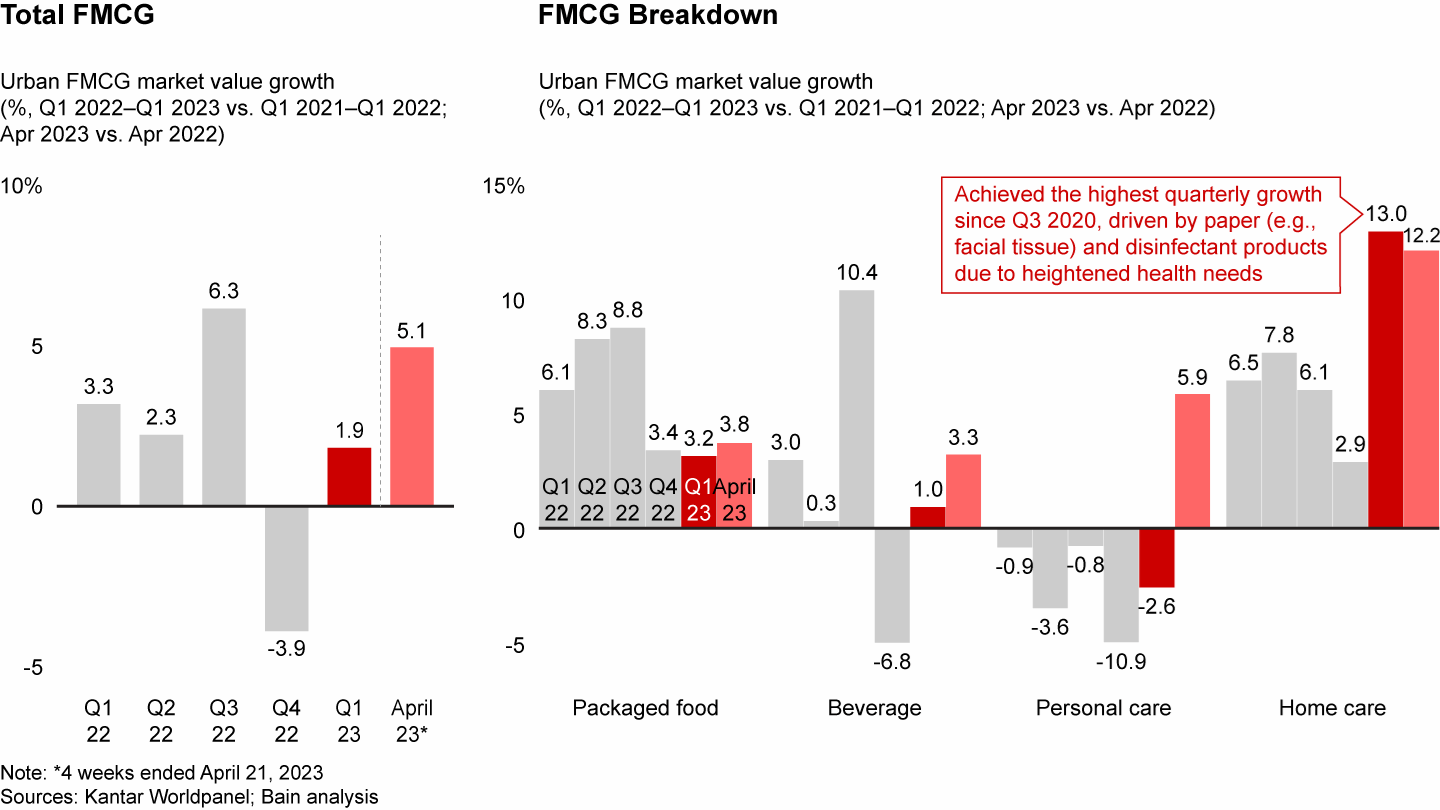
Delving deeper into each sector, home care’s healthy growth was driven by both volume (9.5%) and ASP (3.2%). Nearly all key categories continued to grow due to heightened attention to hygiene and health-related needs. The impact of Covid-19 and influenza infections persisted into the first quarter of 2023 and caused paper-related categories and disinfectants to soar. For instance, facial tissue grew 22.1% in value, with 16.3% growth in volume and 5% growth in price. The heightened focus on hygiene and health-related needs is expected to continue for the rest of the year. In April, the overall home care sector grew 12.2%.
In the packaged food sector, value growth (3.2%) was mainly driven by an ASP increase (5.2%). However, volume dropped 2% as stockpiling behaviors reduced and out-of-home catering occasions increased. Nearly all of the packaged food categories that we tracked (e.g., biscuits, chocolate, candy, and chewing gum) experienced value drops in the first quarter. Even instant noodle’s high-speed growth momentum from 2022 stopped. Instant noodle only slightly increased value in the first quarter (0.9%), driven by an ASP increase of 6.3%. However, seasoning and nutrition supplements maintained their growth trends, due to at-home cooking habits and health needs cultivated during the pandemic era. In April, we observed a fair growth rate of 3.8% in the packaged food sector.
Beverage value grew 1% in the first quarter of 2023, driven by volume growth (3.4%) and ASP decline (-2.4%). Juice, ready-to-drink tea, milk, and packaged water led the sector’s growth. In April, the beverage sector experienced a further growth of 3.3%, displaying its rebound trajectory.
In personal care, the trend of declining value slowed in the first quarter of 2023 (-2.6%), with an increase in volume (4.1%) thanks to an increase in social occasions. Most categories showed healthy volume growth compared with last year. For example, hair conditioner and personal wash achieved volume growth at 6.7% and 6.1% respectively. In April, the sector achieved an exciting growth of 5.9%, providing confidence for the upcoming months.
Categories reflect predictable rebound patterns
The resurgence of Covid-19 outbreaks in December 2022 and January 2023 and gradual improvement from February to April encouraged us to revisit the four distinct category rebound trajectories that were identified in 2020:
• Continuous booming categories benefited during Covid-19 outbreaks in December 2022 and January 2023 and achieved stable growth afterward.
• Boom and stabilize categories grew during outbreaks but did not sustain their growth post-Covid-19.
• V-shape and stabilize categories were hit hard by the pandemic but rebounded afterward.
• L-shape categories declined during and after the outbreak and took longer to recover.
By revisiting these category-specific rebound trajectories, we can better anticipate trends in the coming months. In this study, the four distinct patterns continued into the first quarter of 2023, though the level of divergence was less pronounced, and convergence came much sooner (see Figure 9).
Figure 9
Four distinct rebound trajectories continued; most categories showed consistent rebound trends as in 2020, but one-third responded differently

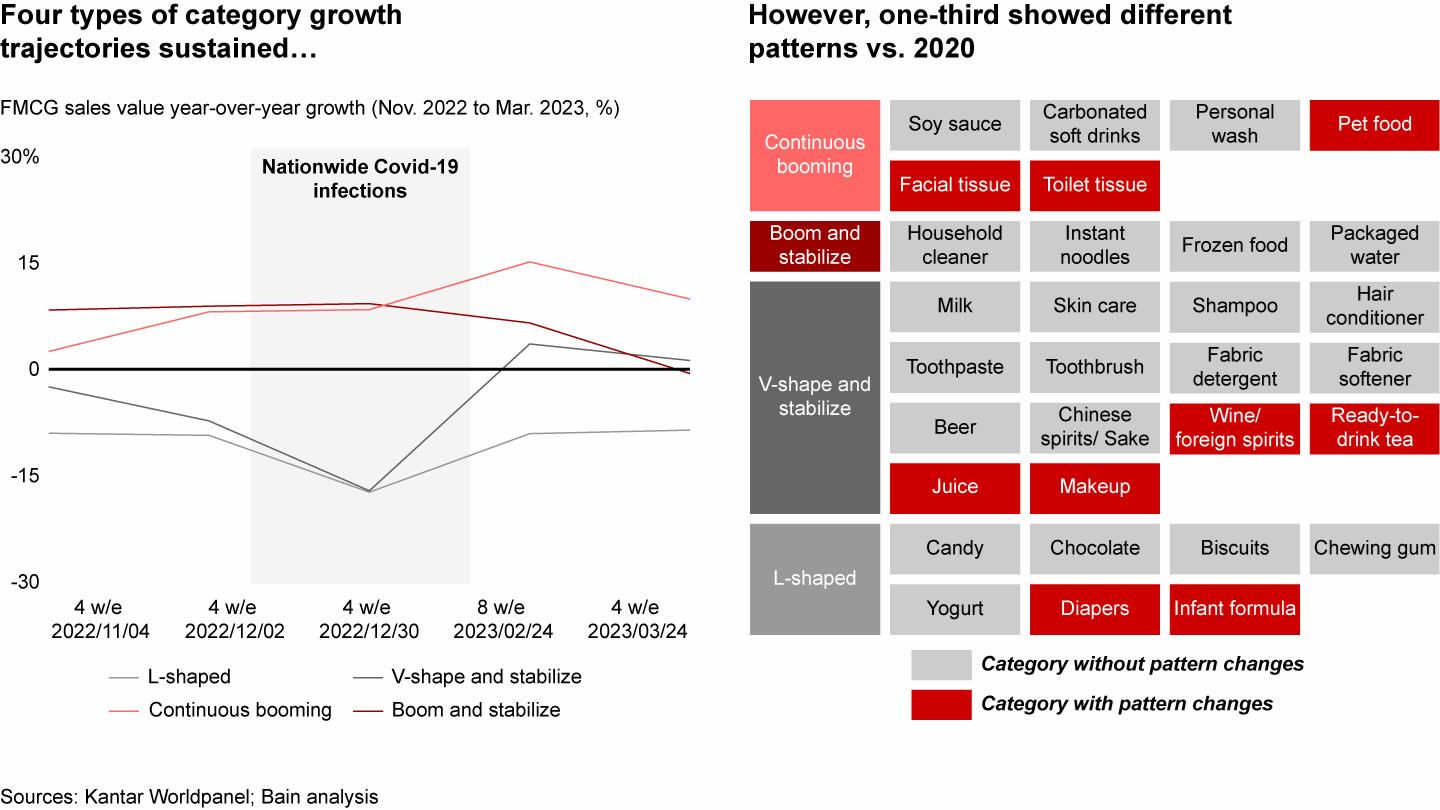
This can be attributed to several factors. First, consumers were more relaxed about stockpiling during nationwide infections given the certainty of policy relaxation. For example, instant noodle was a stockpiling item in the boom and stabilize category during previous outbreaks but experienced relatively milder growth during the more recent infections and stabilized sooner. Second, the release of Covid-19 restrictions encouraged consumers to significantly increase outdoor activities and social gatherings, resulting in a sharper rebound for categories like shampoo, hair conditioner, fabric softener, and fabric detergent.
Zooming into the continuously tracked categories, the majority rebounded similarly to 2020, but a few categories displayed different patterns due to four factors:
• Increased social occasions: The release of Zero-Covid policies and mask mandates had a significant impact on certain categories, such as makeup and wine/foreign spirit, causing the categories to shift from an L-shape to a V-shape. Both categories experienced a notable decline during the nationwide infections in December (-32% and -29%, respectively) but quickly rebounded in March.
• Demographic changes: The number of births declined sharply since 2020 and significantly challenged baby-related categories, especially infant formula and diapers. Though they followed V-shape and boom and stabilize patterns in 2020, they clearly shifted to L-shape in 2023 with a continuous decline.
• Boosted category growth: Category education and consumer lifestyle changes played pivotal roles in driving sustainable growth. Juice and ready-to-drink tea are two categories that shifted from L-shape to V-shape. This transformation can be attributed to flavor innovations, healthier formulations, and appealing packaging designs. As a result, both juice and ready-to-drink tea experienced remarkable rebound post-outbreak, achieving growth rates of 25% and 15%, respectively, in March. Pet food also changed from V-shape to continuous booming, benefiting from lifestyle changes during the pandemic as people spent more time at home and sought companionship through pet ownership. This shift in consumer behavior led to sustained growth in pet food, with 21% growth during the period of national infections in December 2022 and 15% growth in March.
• Constant epidemic outbreaks: In the first quarter, ongoing Covid-19 and influenza A outbreaks increased demand for hygiene and health-related categories such as toilet and facial tissue. As a result, both categories shifted into the continuous booming pattern. Toilet tissue and facial tissue have seen constant growth at ~10% and ~30% respectively since the Covid-19 outbreak in December 2022.
Pricing trends across categories further diverged
Since this year, the inflation has significantly moderated, as evidenced by the 1.3% rise in the CPI in the first quarter of 2023 compared with 2% in 2022. Additionally, it experienced a minimal increase of only 0.1% in April, marking the slowest month of growth since early 2021. Overall FMCG continued its deflationary trend, which has persisted since the beginning of 2020. However, this deflationary trend is not uniform across all categories, channels, or brands.
Facing continuous rising input costs, FMCG brands have pushed for price increases to manage their margins in the first quarter of 2023. However, overall ASP continued to decline in the first quarter of 2023 (-0.8% vs. last year). In general, consumers opted for lower-priced products and shifted toward lower-priced channels like online. Compared with previous years, promotion rates abated a bit (down 1.3%) in both online and offline channels. In the first quarter of 2023, the online promotion rate declined 2.1%, while the offline promotion rate decreased 1.6%.
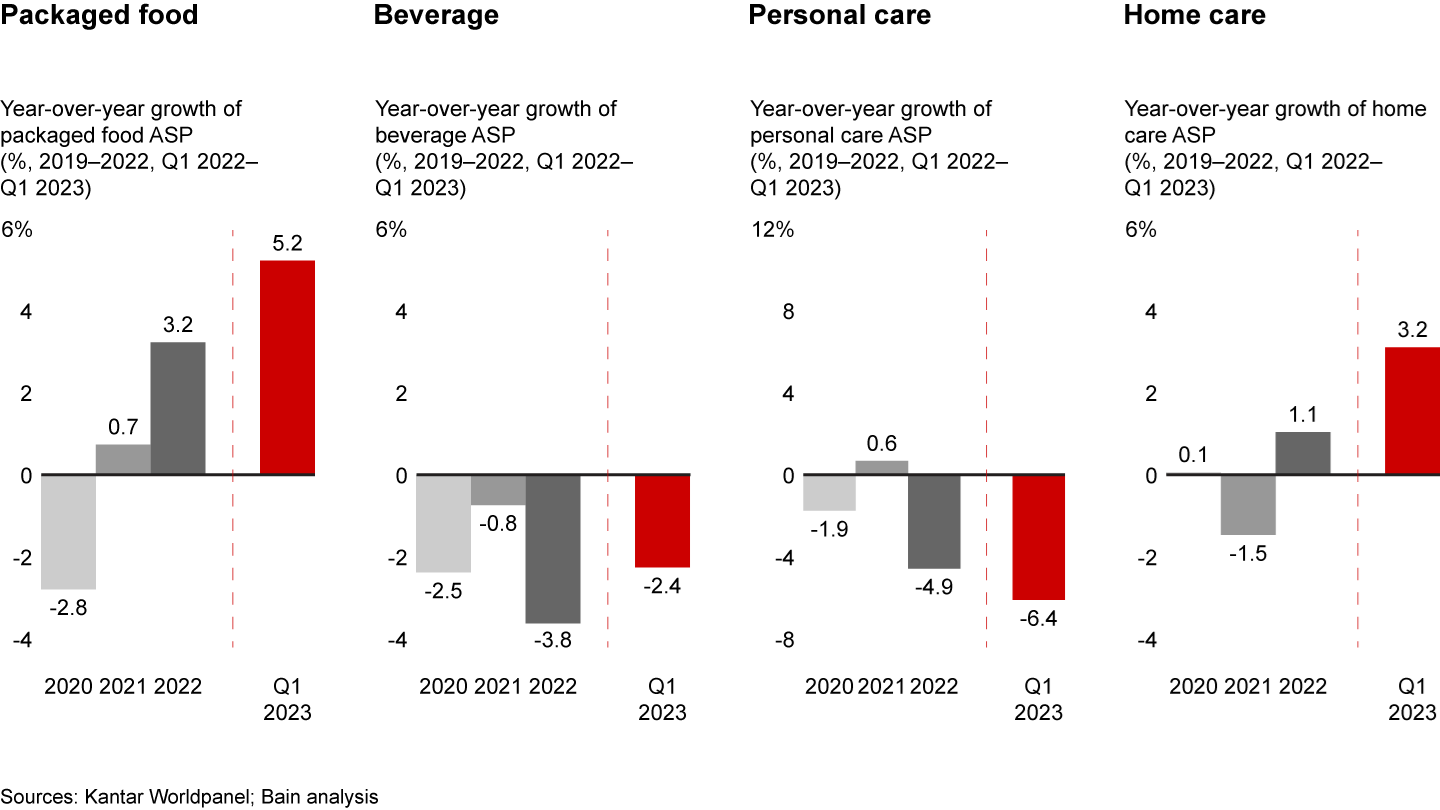
Looking at the four sectors over the past two years, packaged food and home care both managed to reverse the ASP deflation trend by responding to surging demand for necessity products during the pandemic. Conversely, personal care and beverage experienced continuous declines. This can be attributed to consumers’ reduced willingness to pay for products deemed nonessential (see Figure 10).
Figure 10
Packaged food and home care reversed the ASP downtrend over the past two years; beverage and personal care continued their ASP downward trend

FMCG brands across all sectors continued pushing for price increases in the first quarter of 2023. However, consumers reacted to the price increases quite differently across sectors (see Figure 11).
Figure 11
FMCG brands continued pushing for price increase in Q1 2023, but consumers reacted with different approaches across sectors

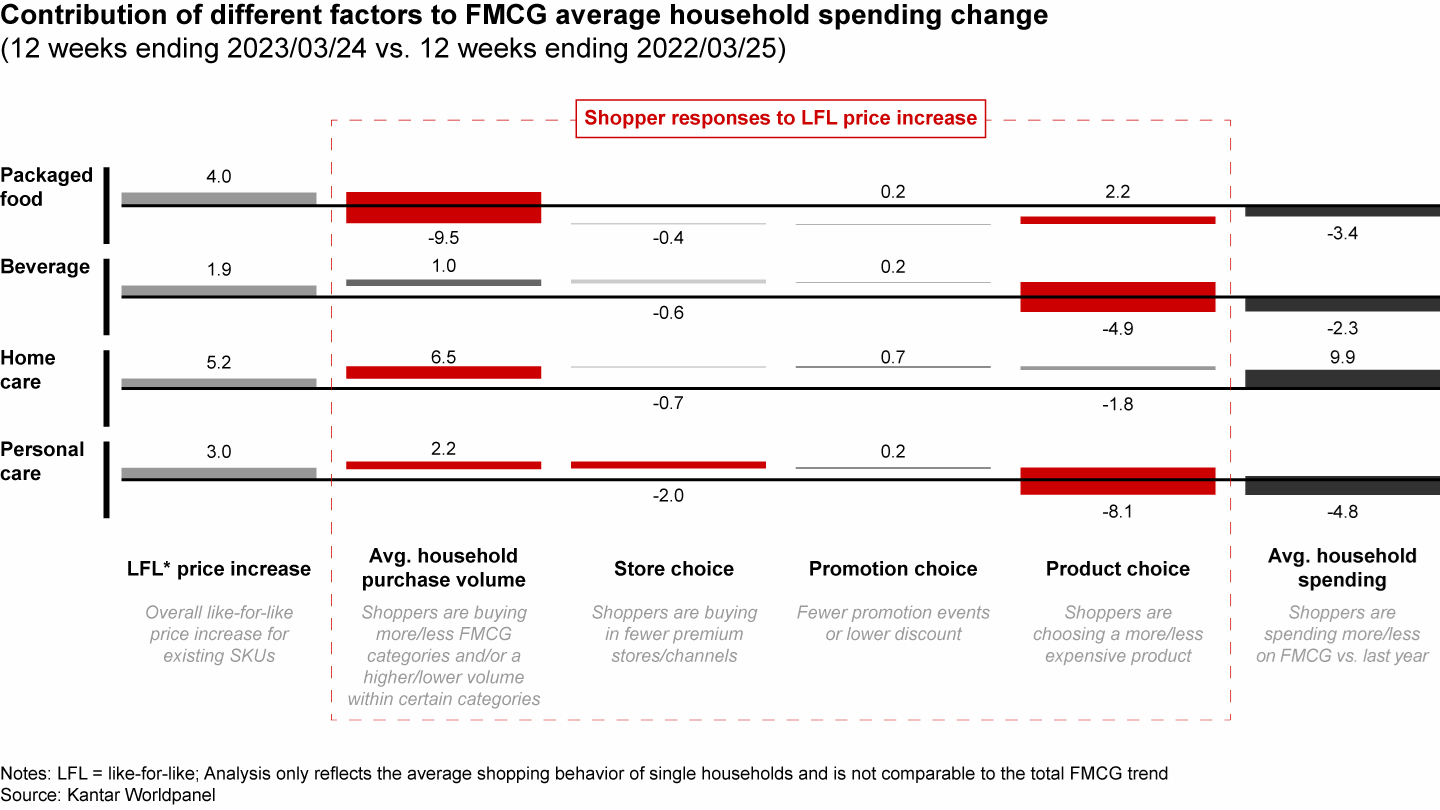
Packaged food: Brands tried to pass inflation costs to consumers with a like-for-like price increase of 4.0% in the first quarter of 2023. Consumers reacted strongly through purchase volume drop and product choice, but didn’t change much in channel selection and promotion participation. The significant volume drop of 9.5% can also be partially explained by the decrease in at-home eating occasions and reduction in stock-up demands thanks to Covid-19 subsiding. Interestingly, consumers are willing to pay for premium products due to rising health awareness, resulting in a 2.2% increase in product choices. Therefore, the average household spend on packaged food showed a 3.4% net decline in the first quarter of 2023.
Beverage: In opposition to the packaged food sector, when beverage faced a lower like-for-like price increase (1.9%), consumers increased purchase volume by 1.0%, but opted for more value-for-money alternatives (-4.9%). As a result, the average household spend experienced a 2.3% net decline.
Home care: Home care brands increased like-for-like price by 5.2%. To cope with the rising product price, some consumers switched to discounted online channels (-0.7%) and opted for more value-for- money options (-1.8%). However, continued heightened hygiene and health awareness drove consumers to keep purchasing more (+6.5%). In the end, average household spending increased by 9.9% in the sector.
Personal care: Consumers reacted most strongly to the price increase in the personal care sector: though brands tried to increase like-for-like prices by 3.0%, average household spending decreased by 4.8%, compared to the same time last year. Although consumers increased volume by 2.2%, thanks to rising demands driven by more outdoor and social occasions, they switched to discounted online channels (-2.0%) and, more importantly, opted for more value-for-money alternatives or simplification of their daily routines (-8.1%).
Zooming into the 26 tracked categories, pricing trends became more divergent. Some categories continuously premiumized with an ASP increase. This occurred primarily within the home care and packaged food sectors, while other sectors (mainly in the beverage and personal care sectors) sustained a decline in ASP (see Figure 12).
Figure 12
Zooming into 26 tracked categories, the ASP trend diverged even more

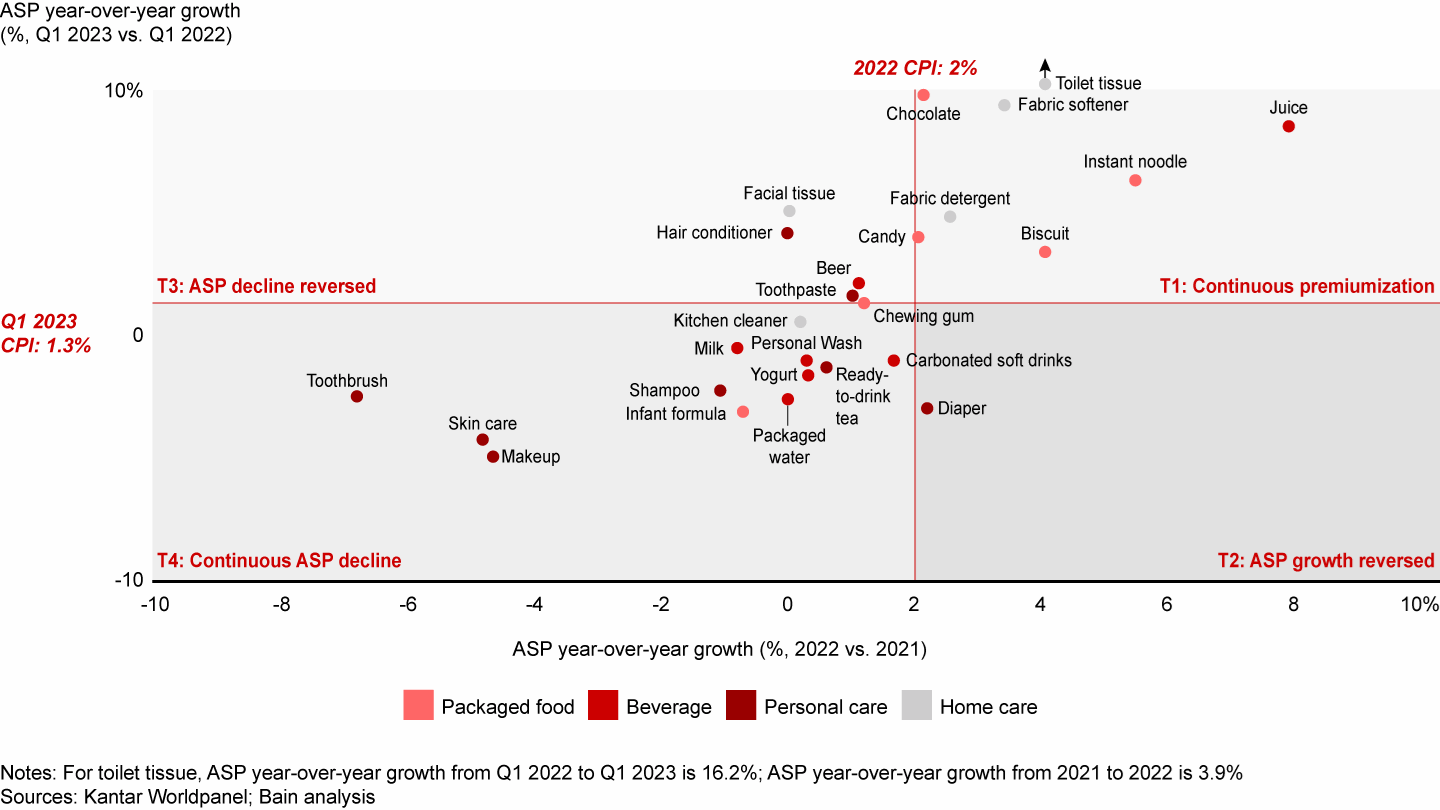
Continuous premiumization: Categories with this pattern experienced success through innovations, many of which addressed heightened health and hygiene needs. Juice, for example, experienced a premiumization trend by introducing products that embodied healthy concepts. In the first quarter of 2023, the premium juice segment experienced 25% volume growth and 7% ASP growth, largely surpassing the growth rate of the midrange and mass segments. Juice innovations included the adoption of new processing methods like NFC, which enhanced the quality and nutritional value of the juice. After introducing NFC plum juice in 2022, Huiyuan(汇源)amplified the NFC concept with the introduction of other flavors, priced at ~RMB 4/100 ml (vs. RMB 1 category average). Additionally, new flavors such as lime juice, hawthorn juice, and sea buckthorn juice played a significant role in driving up the price and attracting health-conscious consumers. Brands like Baienshi(佰恩氏)launched zero-sugar lime juice in March 2023 as a healthier alternative to traditional juice options and commanded a higher price (~RMB 2.5/100 ml). Instant noodle is another example of premiumization. The premium segment of instant noodle experienced 27% volume growth, while the midrange and mass segments showed clear volume declines at 9% and 27%, respectively. Brands have been pushing to turn around the category image by launching premium healthy products and using new technologies (e.g., freeze-drying). Baixiang(白象)introduced Rich Crab Roe Noodle(蟹黄面)in 2022, adding fresh ingredients and no fried noodles, priced at RMB 20+ per box (~5 times higher than normal instant noodle SKUs).
Continuous ASP decline: Categories with this pattern often faced trade-down behaviors or lower demand. A prime example is the toothbrush category, where intensified competition provided consumers with more value-for-money options. Across all price tiers, the mass segment showed the highest volume growth at 4%, with a 9% ASP decrease. More small local brands entered the market in recent years, often offering more affordable options (priced RMB 100–300). Large electronic toothbrush players like Phillips and Oral B responded to this trend by introducing lower-priced product lines. For instance, in 2022, Phillips launched the HX2411 electronic toothbrush priced at around RMB 200. Its premium series is priced RMB 800–2,000. Another example is the infant formula category, which experienced a sharp decline in value over the past few years, primarily attributed to the dropping birth rate. In response, brands have been adopting lower pricing strategies and increasing promotional activities to remain competitive. In the first quarter of 2023, nearly 50% of market value was sold on promotion.
E-commerce reaccelerated, club warehouses soared, and O2O growth was sustained
The lift of Covid-19 policies further shaped the channel dynamics in the FMCG industry. In the first quarter, some historical trends continued, for example the rise of smaller formats (e.g., convenience stores and grocery), the club warehouse format, and O2O. On the other hand, we observed changes compared with previous years. For example, e-commerce went from idle growth in 2022 to accelerated growth in the first quarter of 2023, and hypermarket experienced an amplified decline (see Figure 13).
Figure 13
E-commerce growth rebounded as hypermarket declining trend worsened in Q1 2023; offline small format continued gaining share, partly driven by O2O

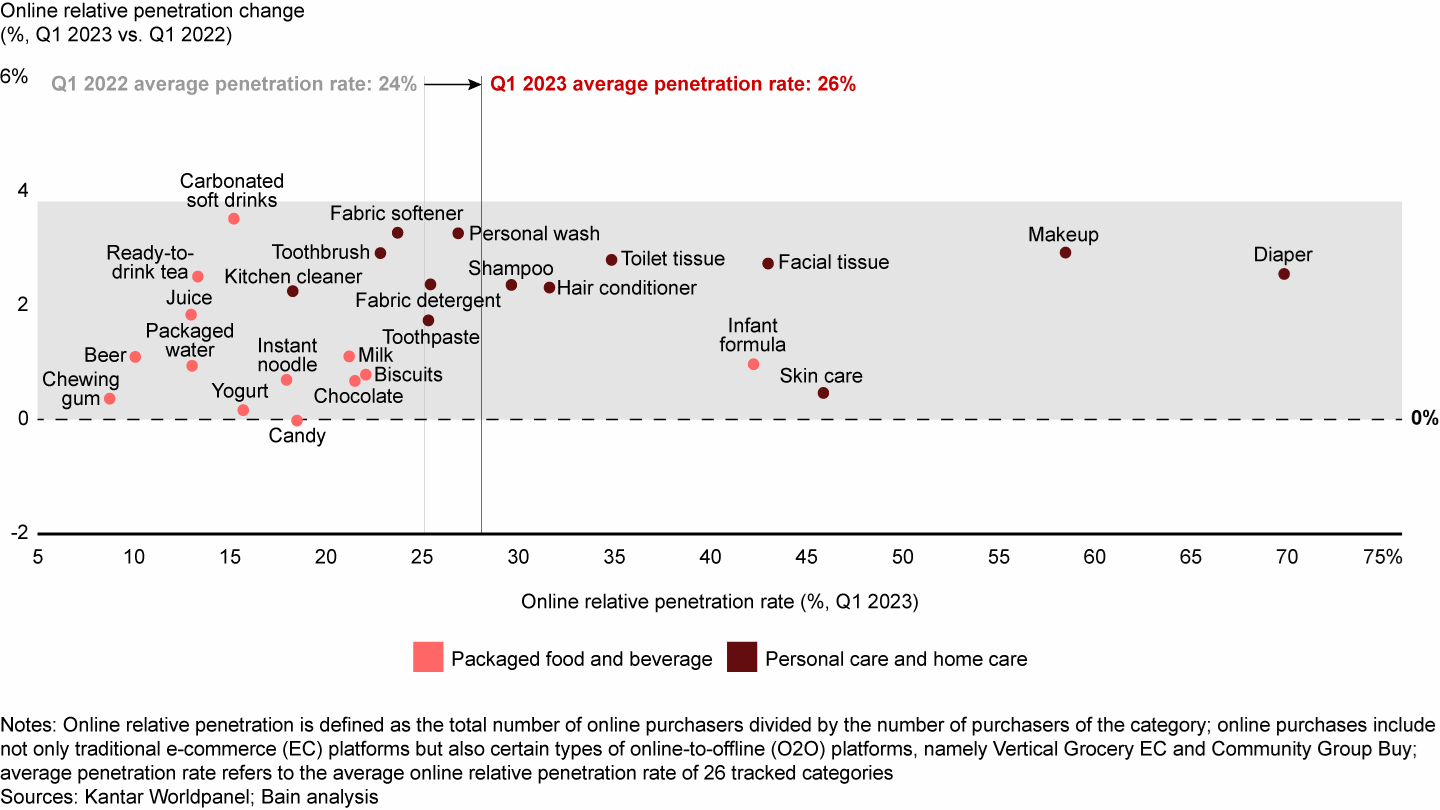
In the first quarter of 2023, consumers accelerated their shift toward online channels, reaching a growth rate of 9%—up from 2% in 2022. The resurgence can be partially attributed to logistics resumption after a severe Covid-19 outbreak in December 2022. All 26 tracked categories showed positive penetration growth in the first quarter of 2023 vs. the first quarter of 2022, whereas more than half of the categories experienced online penetration decline in 2022 (see Figures 14 and 15).
Figure 14
In 2022, online penetration growth lost steam, with only a few categories continuing their upward momentum.

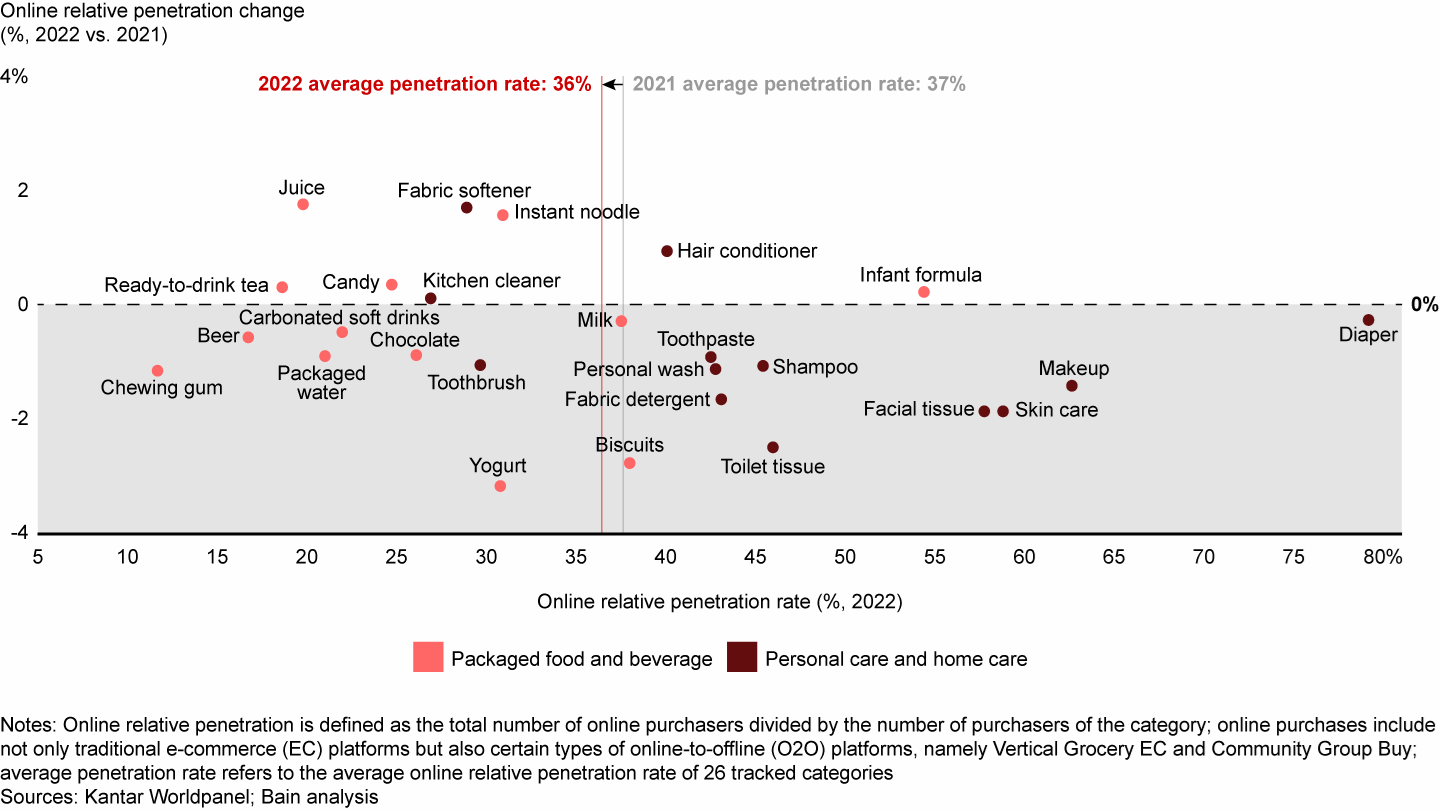
Figure 15
All categories’ online penetration increased in Q1 2023, thanks to subsiding Covid-19 infections and the resumption of logistics

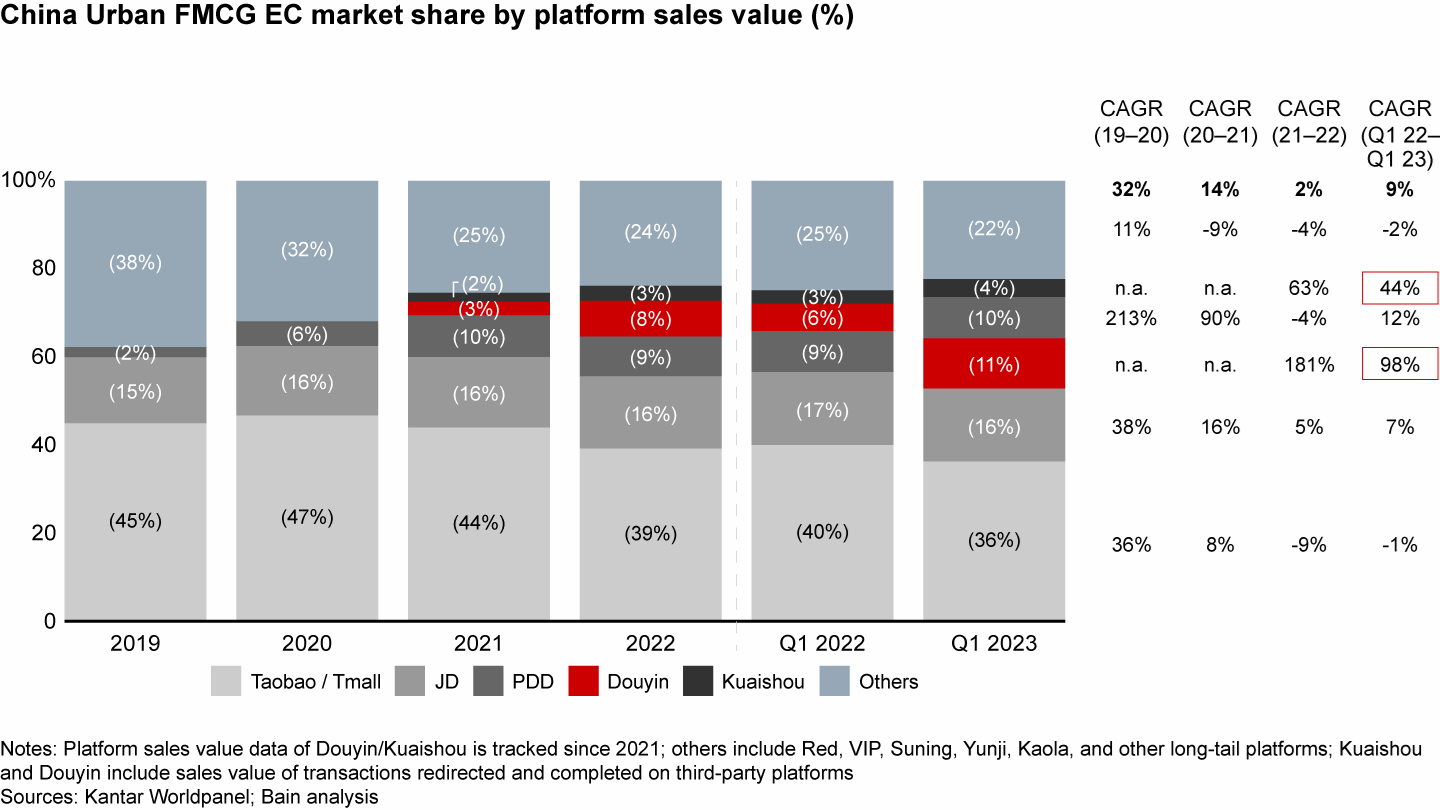
Among e-commerce platforms, interest e-commerce companies like Douyin(抖音)and Kuaishou(快手)led the growth. Douyin gained significant traction in sales value for FMCG with a growth rate of 98%, becoming the third-largest e-commerce platform by sales value for FMCG in the first quarter of 2023 (see Figure 16). Its success could be attributed to its expanding user base, increased livestreaming penetration, and the introduction of new interfaces like Douyin Supermarket.
Figure 16
Douyin overtook PDD for the first time, becoming the third largest e-commerce platform for FMCG in Q1 2023

On the other hand, hypermarkets experienced an amplified downtrend in the first quarter, with a 12% decrease in sales value. This decline was influenced by a reduction in the number of stores, lower foot traffic due to the pandemic, and operational challenges faced by some key accounts.
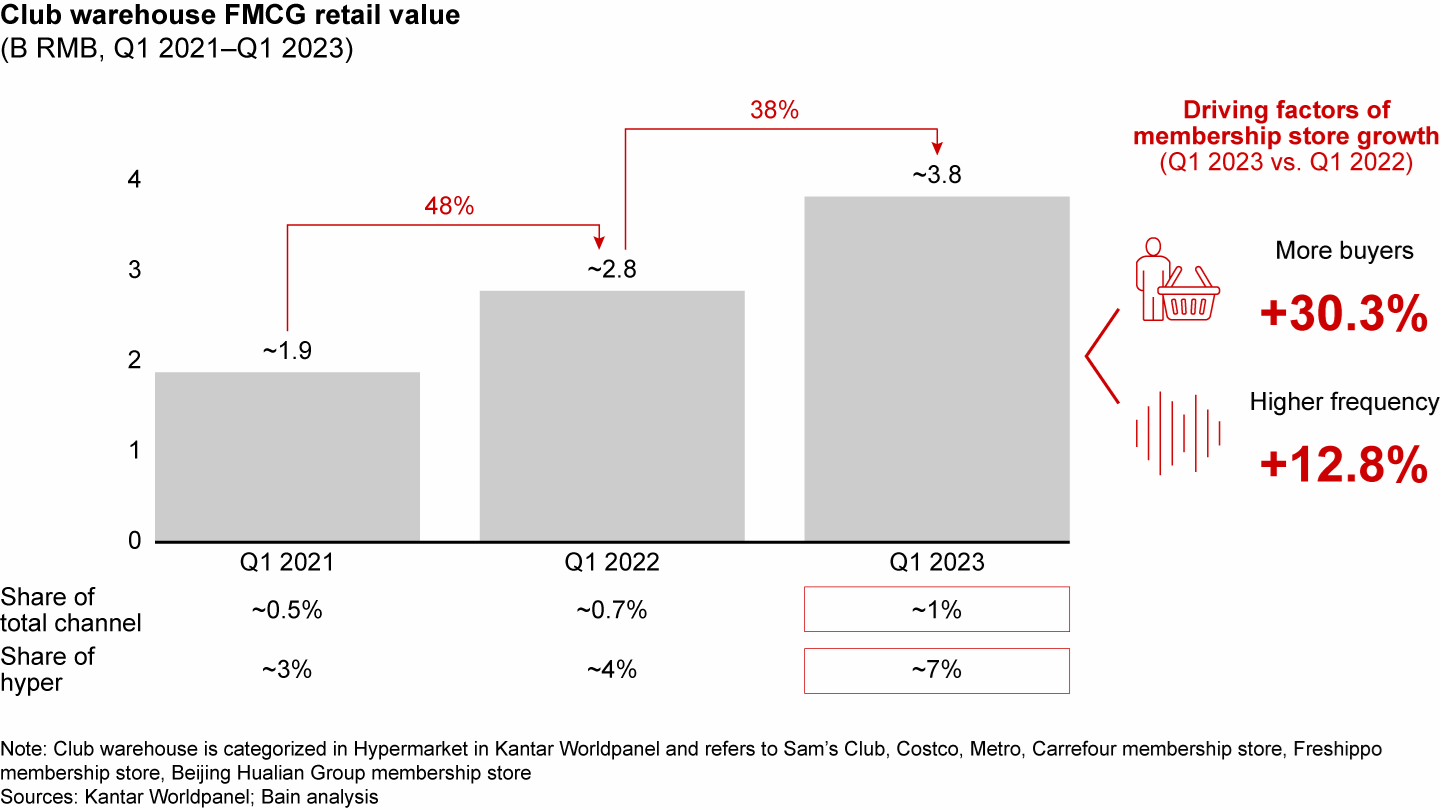
Contrasting with the overall hypermarket trend, club warehouses saw significant growth. The club warehouse differs from a traditional hypermarket in three ways: membership fees drive profit more than product margins, items sold are mainly imported or self-labeled, and products are primarily sold in bulk with lower unit prices vs. single packs. Club warehouses showed a remarkable increase of 38% in the first quarter (see Figure 17). Their growth is attributed to a growing number of buyers (~30%) and increased shopping frequency (~13%).
Figure 17
Though hyper was on the downtrend, club warehouse grew rapidly, driven by both buyer increase and higher frequency

O2O shopping habits have been growing over the past few years and continue to thrive, even after the relaxation of Zero-Covid policies; FMCG O2O witnessed remarkable value growth of 16% in the first quarter. Around 44% of the incremental value was attributed to increased purchase intensity (e.g., higher shopping frequency or higher value per trip), and 36% came from non-O2O channels, particularly offline hypermarkets, supermarkets, and mini markets (see Figure 18).
Figure 18
Online-to-offline continued gaining importance, mainly driven by increasing purchase intensity and gaining from offline hyper/super/mini

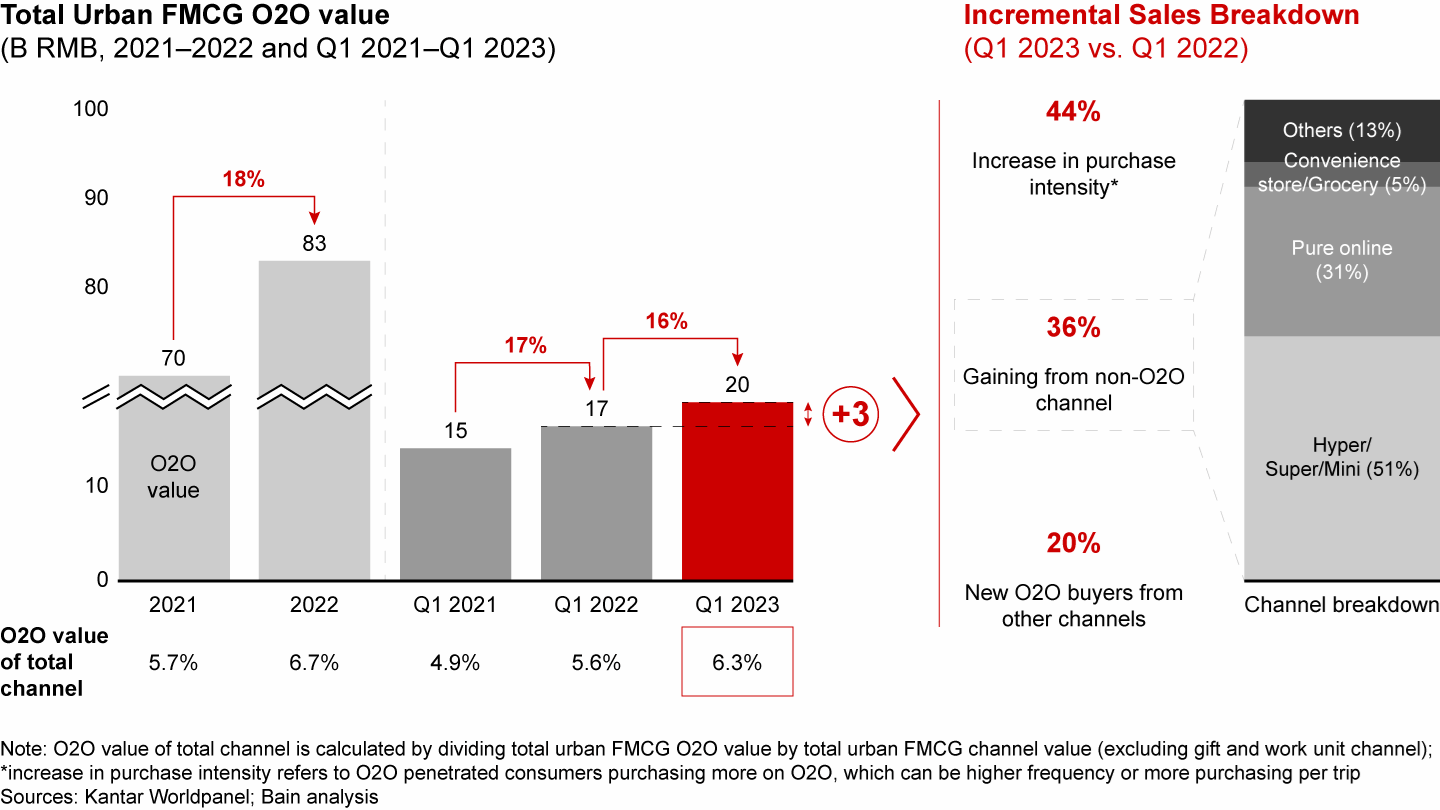
Across different sectors, O2O showed higher importance in food (i.e., packaged food and beverage) than nonfood (i.e., personal care and home care), with 6.6% vs. 5.8% value share, respectively, in the first quarter of 2023. However, nonfood showed more exciting growth at ~30%, driven by a few fast-growing categories (e.g., facial and toilet tissue) and growing cross-purchasing behaviors.
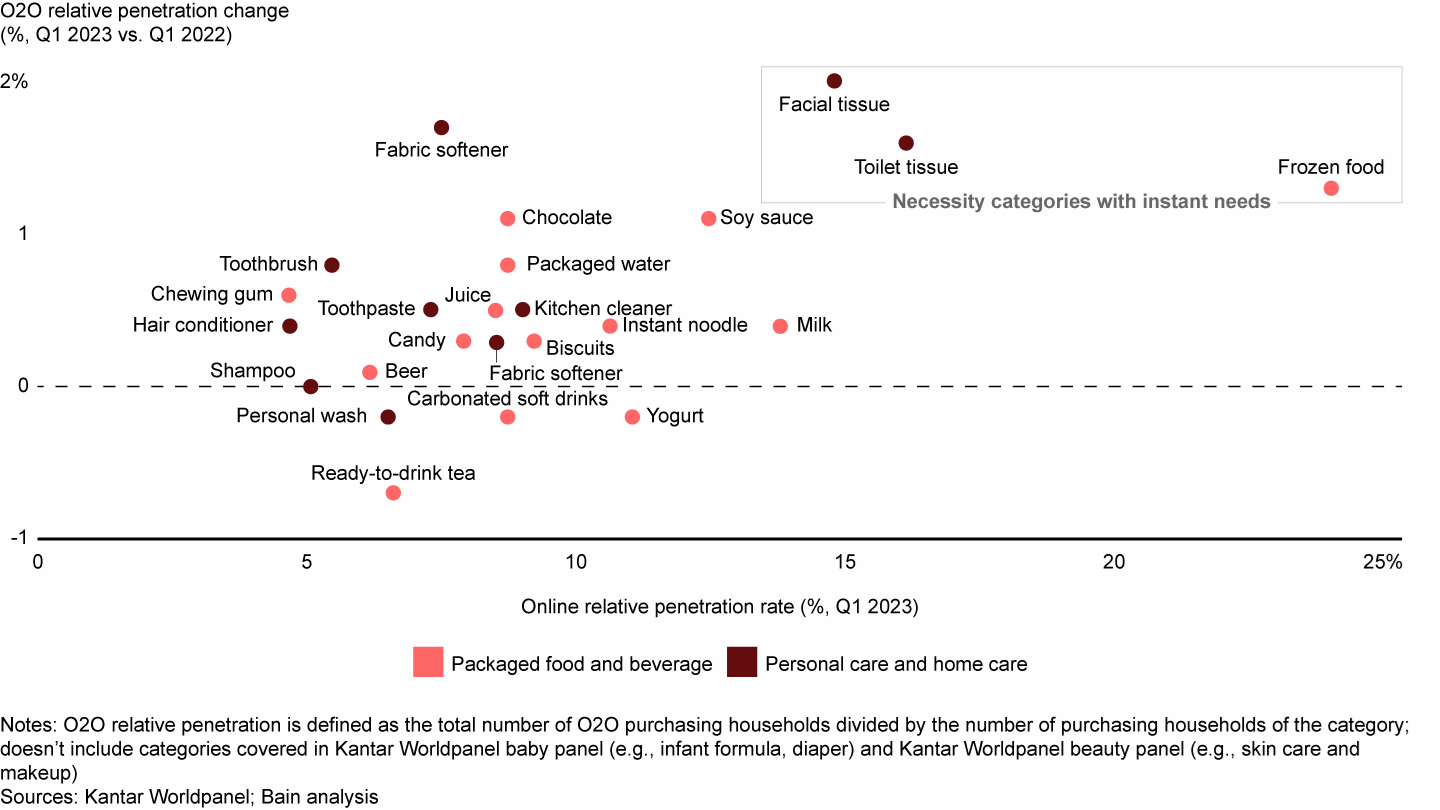
From a category penetration perspective, O2O has distinct patterns compared with online penetration. Necessity categories with instant needs, such as frozen food, facial tissue, and toilet tissue, lead O2O penetration. Consumers are responding favorably to the convenience and fast delivery offered by O2O solutions. Meanwhile, unlike traditional e-commerce, where food and beverage significantly lag in penetration, categories such as soy sauce and milk have surpassed some personal care and home care categories in O2O penetration (see Figure 19).
Figure 19
Necessity categories with instant needs led the O2O penetration; unlike online, some food and beverage O2O penetration exceeded certain personal care and home care categories

Among the four types of O2O platforms we closely tracked, we observed these changing patterns:
Offline retailers such as RT-Mart (大润发优鲜) and Walmart offer O2O services via self-owned or third-party delivery capabilities. Their growth surged 22% in the first quarter of 2023, mainly driven by an aggressive push by retailers to retain their offline store shoppers through O2O solutions. Convenience and wide portfolio offerings are their primary value propositions.
Vertical grocery e-commerce retailers such as Dingdong Maicai (叮咚买菜) rely on self-owned dark stores and their own delivery capabilities. This format lost share this year with negative growth (-10%) mainly due to the closure of a leading player, Missfresh (每日优鲜), in 2022. This model’s best business opportunities are in condensed urban areas, so expansion potential seems limited. In fact, Dingdong Maicai halted operations in ~10 cities in the past 12 months to prioritize profitability.
Community group buying (CGB) platforms such as Duoduo Maicai (多多买菜) and Meituan Youxuan (美团优选) rely on community captains to coordinate orders and deliveries and manage offline pickups. In 2022, lockdowns in top cities significantly boosted CGB penetration and cultivated new consumer habits thanks to their low-price value proposition. In the second half of 2022 and into the first quarter of 2023, we saw aggressive penetration expansion among leading players like Duoduo Maicai (多多买菜) and Taocaicai (淘菜菜). They sustained the rapid growth of the format, achieving ~23% year-over-year growth in the first quarter of 2023.
Horizontal marketplace platforms such as Meituan (美团), JD Daojia (京东到家), and Ele.me (饿了么) serve retailers and brands with O2O distribution capabilities. In 2022, these asset-light platforms saw steady growth at ~18%. In the first quarter of 2023, growth slowed to 10%, mainly due to competition from offline retailers with similar delivery speed but more affluent portfolios.
O2O shopping habits have been cultivated over the past years and are expected to continue, given the clear value propositions of convenience and quick and reliable delivery.
Out-of-home consumption rebounded
Following the release of Covid-19 restrictions in December 2022, consumers have been regaining the confidence to engage in social activities outside their homes. Several indicators such as domestic traffic and catering spending indicated quick rebounds of outdoor consumer activities. This year, we continued to track 11 FMCG categories in food and beverage. We witnessed the out-of-home (OOH) consumption gradually recover and land at 4.6% growth in April for the 11 categories in Tier 1 and 2 cities, showing a positive sign for the rest of year.
Restaurants experienced the highest growth (36%) thanks to an increase in OOH catering occasions. Across the 11 food and beverage categories, most drinks rebounded strongly in April. Beer, juice, and ready-to-drink tea saw outstanding growth rates of 11.0%, 20.7%, and 19.0%, respectively.
What’s next—and implications for brands and retailers
China’s recovery from its year-end Covid-19 outbreak and subsequent release of Zero-Covid policies has produced the expected bounce back in economic activities, as evidenced by first quarter GDP growth and retail sales. Economists expect the recovery to accelerate in the second half, particularly on the back of a low base of comparison in the same period in 2022, when the market was significantly affected. While conditions have improved, macroeconomic obstacles cannot be ignored, such as high youth unemployment, a mixed recovery in the property sector, and overcapacity in the industrial sector.
Consumption will remain the key factor of economic growth, bolstered by a steady recovery in consumer confidence. Furthermore, the government has already implemented stimulus policies to boost consumption, and more are expected. However, we also observed continuous price sensitivity from consumers and a persistent FMCG deflationary environment.
Following the economic recovery, the FMCG industry continues to demonstrate resilience, and consumers, brands, and retailers continue to adapt to ever-changing circumstances. The FMCG recovery is likely to persist over the coming months, repeating a few trends from the first quarter of the year.
To be positioned for success in 2023 and beyond, brands should:
Follow the consumers in their post-Covid-19 needs: Since the conclusion of the Covid-19 pandemic, remarkable shifts in consumer needs and preferences have occurred. For example, a few nonessential categories, especially in personal care and beverage sectors, are likely to experience a demand rebound thanks to more social gatherings. Continued demand for health and hygiene products is expected, driven by the habits cultivated over the past three years of dealing with Covid-19. The FMCG market has pockets of opportunities in new demands, new segments, new geographies, new occasions, new channels, new touchpoints, and so forth. Therefore, brands must closely monitor and understand these ever-evolving demands, as well as keep a vigilant eye on the strategic moves of their competitors, to unleash all the potential growth opportunities.
Manage costs down: With persistent deflationary trends across FMCG, albeit with differences by category, it is critical for brands to manage their costs and focus on what really matters to the consumers in terms of product formulation, raw materials, and packaging materials. The savings achieved in these areas can be invested in marketing and pricing/promotion to address the ongoing price sensitivity.
Build integrated route-to-market strategies: The border between online and offline channels is blurred thanks to the fast development of O2O. Meanwhile, the dynamics among online channels keep evolving (e.g., traditional e-commerce platforms, interest e-commerce, and private domain). Moreover, new offline formats, like the club warehouse, are gaining traction. To fully unleash the opportunities within winning channels, brands should break their strategic planning silos between online and offline. They need to develop integrated strategies with differentiated collaboration models that address the distinct demands of each channel type/customer.
Rejuvenate OOH opportunities: Early signs of consumption trends show that post-Covid-19 consumers are prioritizing experience-based consumption, like travel and OOH meals. With the resurgence of OOH consumption, it is crucial for food and beverage brands to strategically reinvest in food service-related channels, such as restaurants.
Facing intensified competition and changing channel dynamics, retailers should also:
Sharpen their value propositions and enhance shopper loyalty: Given the proliferation of retail formats, retailers should focus on clearly defined core shopper segments and deeply understand their unique preferences and needs. Thus, they can enhance shopper loyalty through differentiated value propositions that are embedded in merchandising, pricing and promotion, and shopper engagements to maximize consumer lifetime value.
Optimize category and assortment: As social activities increase, consumers’ demands will evolve across categories. Retailers should adjust and redefine their category roles accordingly. Because consumers’ product choices vary by category, retailers should assess product economics with demand projections at SKU level within each category and optimize pricing and promotion mechanisms.
Double down on O2O: Consumers have embraced O2O during Covid-19 and are expected to continue to do so beyond Covid-19. Retailers must fully capture this irreversible trend by breaking through silos between online and offline operations. To do so, they can pursue self-built O2O services or seek deep partnerships with the leading O2O platforms, design compelling assortments to maximize full category performance (e.g., drive full potential of necessity categories while nurturing nonfood sectors), adjust the supply chain and fulfillment capability, offer optimal consumer activations, and so forth.
Kantar—Understand People, Inspire Growth
Kantar is one of the world’s leading evidence-based insights and consulting companies. Kantar has a complete, unique and rounded understanding of how people think, feel and act, globally and locally in over 90 markets. By combining the deep expertise of Kantar’s people with its data resources, benchmarks, innovative analytics and technology, Kantar helps clients understand people and inspire growth. In the China market, the Worldpanel division is one of the services in CTR.
Notes
- The scope of the FMCG market in this report doesn’t include 12 new categories tracked by Kantar Worldpanel since 2022, therefore there might be some data discrepancies between this report and other Kantar publications. Kantar Worldpanel has excluded cigarettes from total FMCG data in 2017 and adjusted the online channel weight factor upper threshold for paper products to better reflect market realities in 2020. Skin care and makeup data are collected from the Kantar Worldpanel beauty panel, covering consumers aged from 15–64 in Tier 1–5 cities; infant formula and diaper data are collected from the Kantar Worldpanel baby panel, covering households with babies 0–36 months old in Tier 1-5 cities. All average selling prices are calculated based on RMB per Kg/L, except for diapers and toothbrushes, which are calculated based on RMB per piece; skin care and makeup, which are calculated based on RMB per pack; and toilet and facial tissue, which are calculated based on RMB per 100 sheets/rolls.
- The 26 categories are (a) packaged food: biscuits, chocolate, instant noodle, candy, chewing gum, and infant formula; (b) beverage: milk, yogurt, juice, beer, ready-to-drink tea, carbonated soft drinks, and packaged water; (c) personal care: skin care, shampoo, personal wash, toothpaste, makeup, hair conditioner, diaper, and toothbrushes; and (d) home care: toilet tissue, fabric detergent, facial tissue, kitchen cleaner, and fabric softener.
- In Kantar Worldpanel, online-to-offline (O2O) sales value is categorized in channels where the transactions happen: sales of O2O vertical grocery EC and community group buy are accounted for in e-commerce; O2O offline retailers’ sales are categorized according to the retailers’ main formats (e.g., Walmart O2O sales are categorized in hyper); O2O horizontal marketplaces’ sales are calculated based on the end shopping entities (e.g., if consumer orders from 7-Eleven through Meituan/Ele, the value will be calculated in convenience store).
- The 11 tracked key food and beverage categories are beer, chewing gum, candy, chocolate, milk, yogurt, biscuits, packaged water, ready-to-drink tea, juice and carbonated soft drinks.
- Top 10 offline key accounts are Yonghui, Wumart, Walmart, Vanguard, Suning, Sun Art, Spar, Bailian, Bubugao, and WSL Group.